| Services - tools - models - for embedded software development |
|---|
| Services - tools - models - for embedded software development |
|---|

Application Note 3. Issue 2
November 2008
Copyright © 2008 Embecosm Limited
 | The document entitled " Howto: Porting the GNU Debugger " by Jeremy Bennett of Embecosm is licensed under a Creative Commons Attribution 2.0 UK: England & Wales License. See the Legal Notice for details. |
Table of Contents
This document complements the existing documentation for GDB ([3], [4], [5]). It is intended to help software engineers porting GDB to a new architecture for the first time.
This application note is based on the author's experience to date. It will be updated in future issues. Suggestions for improvements are always welcome.
Although the GDB project includes a 100 page guide to its internals, that document is aimed primarily at those wishing to develop GDB itself. The document also suffers from three limitations.
It tends to document at a detailed level. Individual functions are described well, but it is hard to get the big picture.
It is incomplete. Many of the most useful sections (for example on frame interpretation) are yet to be written.
Is tends to be out of date. For example the documentation of the UI-Independent output describes a number of functions which no longer exist.
Consequently the engineer faced with their first port of GDB to a new architecture is faced with discovering how GDB works by reading the source code and looking at how other architectures have been ported.
The author of this application note went through that process when porting the OpenRISC 1000 architecture to GDB. This document captures the learning experience, with the intention of helping others.
If you are about to start a port of GDB to a new architecture, this document is for you. If at the end of your endeavors you are better informed, please help by adding to this document.
If you have already been through the porting process, please help others by adding to this document.
The main user guide for GDB [3] provides a great deal of context about how GDB is intended to work.
The GDB Internals document [4] is essential reading before and during any porting exercise. It is not complete, nor is it always up to date, but it provides the first place to look for explanation of what a particular function does.
GDB relies on a separate specification of the Binary file format; for each architecture. That has its own comprehensive user guide [5].
The main GDB code base is generally well commented, particularly in the headers for the major interfaces. Inevitably this must be the definitive place to find out exactly how a particular function behaves.
The files making up the port for the OpenRISC 1000 are comprehensively commented, and can be processed with Doxygen [7]. Each function's behavior, its parameters and any return value is described.
The main GDB website is at sourceware.org/gdb/. It is supplemented by the less formal GDB Wiki at sourceware.org/gdb/wiki/.
The GDB developer community communicate through the GDB mailing lists and using IRC chat. These are always good places to find solutions to problems.
The main mailing list for discussion is gdb@sourceware.org, although for detailed understanding, the patches mailing list, gdb-patches@sourceware.org. See the main GDB website for details of subscribing to these mailing lists.
IRC is channel #gdb on
irc.freenode.net.
Embecosm is a consultancy specializing in open source tools, models and training for the embedded software community. All Embecosm products are freely available under open source licenses.
Embecosm offers a range of commercial services.
Customization of open source tools and software, including porting to new architectures.
Support, tutorials and training for open source tools and software.
Custom software development for the embedded market, including bespoke software models of hardware.
Independent evaluation of software tools.
For further information, visit the Embecosm website at www.embecosm.com.
There are three major areas to GDB:
GDB has a very simple view of a processor. It has a block of memory and a block of registers. Executing code contains its state in the registers and in memory. GDB maps that information to the source level program being debugged.
Porting a new architecture to GDB means providing a way to read executable files, a description of the ABI, a description of the physical architecture and operations to access the target being debugged.
Probably the most common use of GDB is to debug the architecture on which it is actually running. This is native debugging where the architecture of the host and target are the same.
For the OpenRISC 1000 GDB is normally run on a host separate to the target (typically a workstation) connecting to the OpenRISC 1000 target via JTAG, using the OpenRISC 1000 Remote JTAG Protocol. Remote debugging in this way is the most common method of working for embedded systems.
A full Glossary is provided at the end of this document. However a number of key concepts are worth explaining up front.
Exec or program. An executable program, i.e. a binary file which may be run independently of other programs. Commonly the term program is found in user documentation, and exec in comments and GDB internal documentation.
Inferior. A GDB entity representing a program or exec which has run, is running, or will run in the future. An inferior corresponds to a process or a core dump file.
Address space. A GDB entity which can interpret addresses (that is values of type CORE_ADDR). Inferiors must have at least one address space and inferiors may share an address space.
Thread. A single thread of control within an inferior.
The OpenRISC 1000 port for GDB is designed for "bare metal" debugging, so will have only a single address space and inferiors with a single thread.
BFD is a package which allows applications to use the same routines to operate on object files whatever the object file format. A new object file format can be supported simply by creating a new BFD back end and adding it to the library.
The BFD library back end creates a number of data structures describing the data held in a particular type of object file. Ultimately a unique enumerated constant (of type enum bfd_architecture) is defined for each individual architecture. This constant is then used to access the various data structures associated with the BFD of the particular architecture.
In the case of the OpenRISC 1000, 32-bit implementation (which may
be a COFF or ELF binary), the
enumerated constant is bfd_arch_or32.
BFD is part of the binutils package. A binutils implementation must be provided for any architecture intending to support the GNU tool chain.
The OpenRISC 1000 is supported by the GNU tool chain. BFD back ends already exist which are suitable for use with 32-bit OpenRISC 1000 images in ELF or COFF format as used with either the RTEMS or Linux operating systems.
Any architecture to be debugged by GDB is described in a struct gdbarch. When an object file is to be debugged, GDB will select the correct struct gdbarch using information about the object file captured in its BFD.
The data in struct gdbarch facilitates both the symbol side processing (for which it also uses the BFD information) and the target side processing (in combination with the frame and target operation information).
struct gdbarch is a mixture of data values (number of bytes in an integer for example) and functions to perform standard operations (e.g. to print the registers). The major functional groups are:
Data values capturing details of the hardware architecture. For example the endianism and the number of bits in an address and in a word. Some of this data is captured in the BFD, to which there is a reference in the struct gdbarch. There is also a structure, struct gdbarch_tdep to capture additional target specific data, beyond that which is covered by the standard struct gdbarch.
Data values describing how all the standard high level scalar data structures are represented (char, int, double etc).
Functions to access and display registers. GDB includes the concept of "pseudo-registers", those registers which do not physically exist, but which have a meaning within the architecture. For example in the OpenRISC 1000, floating point registers are actually the same as the General Purpose Registers. However a set of floating point pseudo-registers could be defined, to allow the GPRs to be displayed in floating point format.
Functions to access information on stack frames. This includes setting up "dummy" frames to allow GDB to evaluate functions (for example using the call command).
An architecture will need to specify most of the contents of
struct gdbarch, for which a set of functions (all starting
set_gdbarch_) are provided. Defaults are provided
for all entries, and in a small number of cases these will be
suitable.
Analysis of the stack frames of executing programs is complex with different approaches needed for different circumstances. A set of functions to identify stack frames and analyze their contents is associated with each struct gdbarch.
A set of utility functions are provided to access the members of
struct gdbarch. Element xyz of a struct gdbarch pointed to
by g may be accessed by using
gdbarch_xyz (g, ...). This will check,
using gdb_assert that g is
defined, and in the case of functions that g->x
is not NULL and return either the value g->xyz
(for values) or the result of calling
g->xyz (...) (for functions). This saves the
user testing for existence before each function call, and ensures
any errors are handled cleanly.
A set of operations is required to access a program using the target architecture described by struct gdbarch in order to implement the target side functionality. For any given architecture there may be multiple ways of connecting to the target, specified using the GDB target command. For example with the OpenRISC 1000 architecture, the connection may be directly to a JTAG interface connected through the host computer's parallel port, or through the OpenRISC 1000 Remote JTAG Protocol over TCP/IP.
These target operations are described in a struct target_ops. As with struct gdbarch this comprises a mixture of data and functions. The major functional groups are:
Functions to establish and close down a connection to the target.
Functions to access registers and memory on the target.
Functions to insert and remote breakpoints and watchpoints on the target.
Functions to start and stop programs running on the target.
A set of data describing the features of the target, and hence what operations can be applied. For example when examining a core dump, the data can be inspected, but the program cannot be executed.
As with struct gdbarch, defaults are provided for the struct target_ops values. In many cases these are sufficient, so need not be provided.
GDB's command handling is intended to be extensible. A set of
functions (defined in cli-decode.h) provide
that extensibility.
GDB groups its commands into a number of command lists (of
struct cmd_list_element), pointed to by
a number of global variables (defined in
cli-cmds.h). Of these, cmdlist
is the list of all defined commands. Separate lists define
sub-commands of various top level commands. For example
infolist is the list of all info
sub-commands.
Commands are also classified according the the area they address, for
example commands that provide support, commands that examine data,
commands for file handling etc. These classes are specified by
enum command_class, defined in
command.h. These classes provide the top level
categories in which help will be given.
A GDB description for a new architecture, arch is created by
defining a global function
_initialize_arch_tdep, by
convention in the source file arch-tdep.c. In the
case of the OpenRISC 1000, this function is called
_initialize_or1k_tdep and is found in the file
or1k-tdep.c.
The resulting object files containing the implementation of the
_initialize_arch_tdep function are specified in
the GDB configure.tgt file, which includes a
large case statement pattern matching against the
--target option of the configure
command.
The new struct gdbarch is created within the
_initialize_arch_tdep function by calling
gdbarch_register:
void gdbarch_register (enum bfd_architecture    architecture,
                       gdbarch_init_ftype      *init_func,
                       gdbarch_dump_tdep_ftype *tdep_dump_func);
For example the _initialize_or1k_tdep creates
its architecture for 32-bit OpenRISC 1000 architectures by calling.
gdbarch_register (bfd_arch_or32, or1k_gdbarch_init, or1k_dump_tdep);
The architecture enumeration will identify the
unique BFD for this architecture (see Section 2.2.1). The init_func is called to create and return
the new struct gdbarch (see Section 2.3). The
tdep_dump_func is a function which will dump the
target specific details associated with this architecture (also
described in Section 2.3).
The call to gdbarch_register (see Section 2.2) specifies a function which will
define a struct gdbarch for a particular BFD architecture.
struct gdbarch  gdbarch_init_func (struct gdbarch_info  info,
                                   struct gdbarch_list *arches);
For example, in the case of the OpenRISC 1000 architecture, the
initialization function is or1k_gdbarch_init.
The first argument to the architecture initialization function is a
struct gdbarch_info containing all the known information about this
architecture (deduced from the BFD enumeration provided to
gdbarch_register). The second argument is a list
of the currently defined architectures within GDB.
The lookup is done using
gdbarch_list_lookup_by_info. It is passed the
list of existing architectures and the struct gdbarch_info (possibly
updated) and returns the first matching architecture it finds, or
NULL if none are found. If an architecture is found, the
initialization function can finish, returning the found architecture
as result.
The struct gdbarch_info has the following components:
struct gdbarch_info
{
  const struct bfd_arch_info *bfd_arch_info;
  int                         byte_order;
  bfd                        *abfd;
  struct gdbarch_tdep_info   *tdep_info;
  enum gdb_osabi              osabi;
  const struct target_desc   *target_desc;
};
bfd_arch_info holds the key details about the
architecture. byte_order is an enumeration
indicating the endianism. abfd is a pointer to
the full BFD, tdep_info is additional custom
target specific information, gdb_osabi is an
enumeration identifying which (if any) of a number of operating
specific ABIs are used by this architecture and
target_desc is a set of name-value pairs with
information about register usage in this target.
When the struct gdbarch initialization function is called, not all the
fields are provided—only those which can be deduced from the
BFD. The struct gdbarch_info is used as a look-up key with the list of
existing architectures (the second argument to the initialization
function) to see if a suitable architecture already exists. The
tdep_info osabi and
target_desc fields may be added before this
lookup to refine the search.
If no architecture is found, then a new architecture must be
created, by calling gdbarch_alloc using the
supplied struct gdbarch_info and and any additional custom target specific
information in a struct gdbarch_tdep.
The newly created struct gdbarch must then be populated. Although there are
default values, in most cases they are not what is required. For each
element, X, there is a corresponding accessor
function to set the value of that element,
set_gdbarch_X.
The following sections identify the main elements that should be set
in this way. This is not the complete list, but represents the
functions and elements that must commonly be specified for a new
architecture. Many of the functions are described in the header file,
gdbarch.h and many may be found in the GDB
Internals document [4].
struct gdbarch *gdbarch_alloc (const struct gdbarch_info *info,
                               struct gdbarch_tdep       *tdep);
struct gdbarch_tdep is not defined within GDB—it is up to the
user to define this struct if it is needed to
hold custom target information that is not covered by the standard
struct gdbarch. For example with the OpenRISC 1000 architecture it is
used to hold the number of matchpoints available in the target
(along with other information). If there is no additional target
specific information, it can be set to NULL.
A set of values in struct gdbarch define how different data types are represented within the architecture.
short_bit. Number of bits in a C/C++
short variable. Default is
2*TARGET_CHAR_BIT.
TARGET_CHAR_BIT is a defined constant, which
if not set explicitly defaults to 8.
int_bit, long_bit,
long_long_bit, float_bit,
double_bit,
long_double_bit. These are analogous to
short and are the number of bits in a C/C++
variable of the corresponding time. Defaults are
4*TARGET_CHAR_BIT for int,
long and float and
4*TARGET_CHAR_BIT for long long,
double and long double.
ptr_bit. Number of bits in a C/C++
pointer. Default is 4*TARGET_CHAR_BIT.
addr_bit. Number of bits in a C/C++
address. Almost always this is the same as the number of bits in
a pointer, but there are a small number of architectures for
which pointers cannot reach all addresses. Default is
4*TARGET_CHAR_BIT.
float_format,
double_format and
long_double_format. These point to an array
of C structs (one for each endianism),
defining the format for each of the floating point types. A
number of these arrays are predefined. They in turn are built on
top of a set of standard types defined by the library
libiberty.
char_signed. 1 if char to be
treated as signed, 0 if char is to be treated as
unsigned. The default is -1 (undefined), so this should always
be set.
A set of function members of struct gdbarch define aspects of the architecture and its ABI. For some of these functions, defaults are provided which will be suitable for most architectures.
return_value. This function determines the
return convention for a given data type. For example on the
OpenRISC 1000, structs/unions and large (>32 bit) scalars are
returned as references, while small scalars are returned in
GPR 11. This function should always be defined.
breakpoint_from_pc. Returns the breakpoint
instruction to be used when the PC is at a particular location
in memory. For architectures with variable length instructions,
the choice of breakpoint instruction may depend on the length of
the instruction at the program counter. Returns the instruction
sequence and its length.
The default value is NULL (undefined). This function should
always be defined if GDB is to support breakpointing for this
architecture.
adjust_breakpoint_address. Some
architectures do not allow breakpoints to be placed at all
points. Given a program counter, this function returns an
address where a breakpoint can be
placed. Default value is NULL (undefined). The function need
only be defined for architectures which cannot accept a
breakpoint at all program counter locations.
memory_insert_breakpoint and
memory_remove_breakpoint. These functions
insert or remove memory based (a.k.a. soft) breakpoints. The
default values
default_memory_insert_breakpoint and
default_memory_remove_breakpoint are
suitable for most architectures, so in most cases these
functions need not be defined.
decr_pc_after_break. Some architectures
require the program counter to be decremented after a break, to
allow the broken instruction to be executed on resumption. This
function returns the number of bytes by which to decrement the
address. The default value is NULL (undefined) which means the
program counter is left unchanged. This function need only be
defined if the functionality is required.
In practice this function is only of use for the very simplest
architectures. It applies only to software breakpoints, not
watchpoints or hardware breakpoints. It is more usual to adjust
the program counter as required in the target
to_wait and to_resume
functions (see Section 2.4).
single_step_through_delay. Returns 1 if the
target is executing a delay slot and a further single step is
needed before the instruction finishes. The default value is
NULL (not defined). This function should be implemented if the
target has delay slots.
print_insn. Disassemble an instruction and
print it. Default value is NULL (undefined). This function
should be defined if disassembly of code is to be supported.
Disassembly is a function required by the
binutils library. This function is
defined in the opcodes sub-directory. A
suitable implementation may already exist if
binutils has already been ported.
GDB considers registers to be a set with members numbered linearly from 0 upwards. The first part of that set corresponds to real physical registers, the second part to any "pseudo-registers". Pseudo-registers have no independent physical existence, but are useful representations of information within the architecture. For example the OpenRISC 1000 architecture has up to 32 general purpose registers, which are typically represented as 32-bit (or 64-bit) integers. However it could be convenient to define a set of pseudo-registers, to show the GPRs represented as floating point registers.
For any architecture, the implementer will decide on a mapping from hardware to GDB register numbers. The registers corresponding to real hardware are referred to as raw registers, the remaining registers are pseudo-registers. The total register set (raw and pseudo) is called the cooked register set.
These functions specify the number and type of registers in the architecture.
read_pc and
write_pc. Functions to read the program
counter. The default value is NULL (no function
available). However, if the program counter is just an ordinary
register, it can be specified in struct gdbarch instead (see
pc_regnum below) and it will be read or
written using the standard routines to access registers. Thus
this function need only be specified if the
program counter is not an ordinary register.
pseudo_register_read and
pseudo_register_write. These functions
should be defined if there are any pseudo-registers (see Section 2.2.2 and Section 2.3.5.3 for more information on
pseudo-registers). The default value is NULL.
num_regs and
num_pseudo_regs. These define the number of
real and pseudo-registers. They default to -1 (undefined) and
should always be explicitly defined.
sp_regnum, pc_regnum,
ps_regnum and
fp0_regnum. These specify the register
holding the stack pointer, program counter, processor status
and first floating point register. All except the first
floating-point register (which defaults to 0) default to -1
(not defined). They may be real or
pseudo-registers. sp_regnum must always be
defined. If pc_regnum is not defined, then
the functions read_pc and
write_pc (see above) must be defined. If
ps_regnum is not defined, then the
$ps variable will not be available to the
GDB user. fp0_regnum is not needed unless
the target offers support for floating point.
These functions return information about registers.
register_name. This function should
convert a register number (raw or pseudo) to a register name
(as a C char *). This is used both to
determine the name of a register for output and to work out
the meaning of any register names used as input. For example
with the OpenRISC 1000, GDB registers 0-31 are the General Purpose
Registers, register 32 is the program counter and register 33
is the supervision register, which map to the strings
"gpr00" through "gpr31",
"pc" and "sr"
respectively. This means that the GDB command print
$gpr5 should print the value of the OR1K general
purpose register 5. The default value for this function is
NULL. It should always be defined.
Historically, GDB always had a concept of a frame
pointer register, which could be accessed via the
GDB variable, $fp. That concept is now
deprecated, recognizing that not all architectures have a
frame pointer. However if an architecture does have a frame
pointer register, and defines a register or pseudo-register
with the name "fp", then that register will
be used as the value of the $fp variable.
register_type. Given a register number,
this function identifies the type of data it may be holding,
specified as a
struct type. GDB allows
creation of arbitrary types, but a number of built in types
are provided (builtin_type_void,
builtin_type_int32 etc), together with
functions to derive types from these. Typically the program
counter will have a type of "pointer to function" (it points
to code), the frame pointer and stack pointer will have types
of "pointer to void" (they point to data on the stack) and all
other integer registers will have a type of 32-bit integer or
64-bit integer. This information guides the formatting when
displaying out register information. The default value is
NULL meaning no information is available to guide formatting
when displaying registers.
print_registers_info. Define this function
to print out one or all of the registers for the GDB
info registers command. The default
value is the function
default_print_registers_info which uses the
type information (see register_type above)
to determine how each register should be printed. Define this
function for fuller control over how the registers are
displayed.
print_float_info and
print_vector_info. Define this function to
provide output for the GDB info float
and info vector commands
respectively. The default value is NULL (not defined), meaning
no information will be provided. Define each function if the
target supports floating point or vector operations
respectively.
register_reggroup_p. GDB groups
registers into different categories (general, vector, floating
point etc). This function given a register and group returns 1
(true) if the register is in the group and 0 otherwise. The
default value is the function
default_register_reggroup_p which will do
a reasonable job based on the type of the register (see the
function register_type above), with
groups for general purpose registers, floating point
registers, vector registers and raw (i.e not pseudo)
registers.
Caching of registers is used, so that the target does not need to be accessed and reanalyzed multiple times for each register in circumstances where the register value cannot have changed.
GDB provides struct regcache, associated with a particular struct gdbarch to
hold the cached values of the raw registers. A set of functions is
provided to access both the raw registers (with
raw in their name) and the full set of cooked
registers (with cooked in their name). Functions
are provided to ensure the register cache is kept synchronized with
the values of the actual registers in the target.
Accessing registers through the struct regcache routines will ensure that the appropriate struct gdbarch functions are called when necessary to access the underlying target architecture. In general users should use the "cooked" functions, since these will map to the "raw" functions automatically as appropriate.
The two key functions are regcache_cooked_read
and regcache_cooked_write which read or write a
register to or from a byte buffer (type
gdb_byte *). For convenience the wrapper functions
regcache_cooked_read_signed,
regcache_cooked_read_unsigned,
regcache_cooked_write_signed and
regcache_cooked_write_unsigned are provided,
which read or write the value and convert to or from a value as
appropriate.
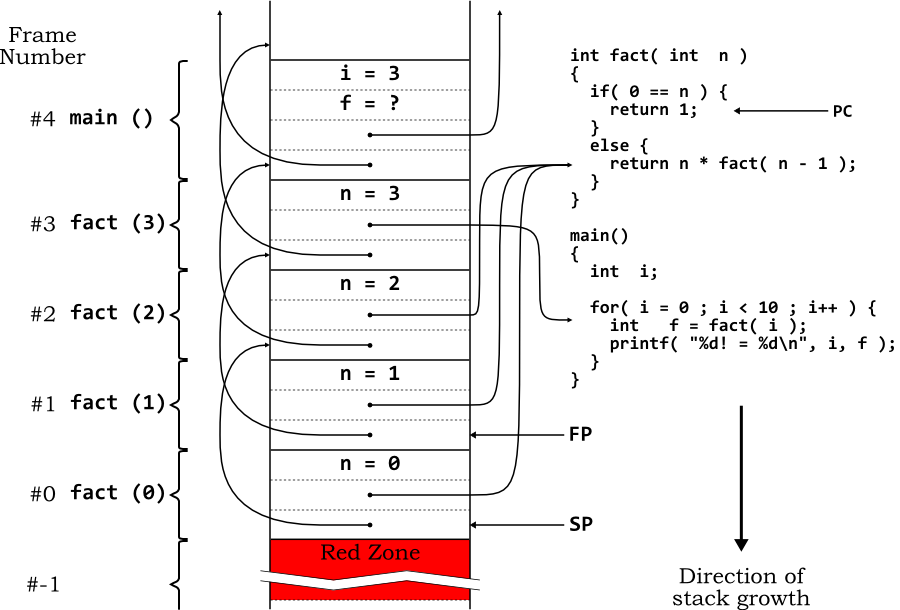
GDB needs to understand the stack on which local (automatic) variables are stored. The area of the stack containing all the local variables for a function invocation is known as the stack frame for that function (or colloquially just as the "frame"). In turn the function that called the function will have its stack frame, and so on back through the chain of functions that have been called.
Almost all architectures have one register dedicated to point to the end of the stack (the stack pointer). Many have a second register which points to the start of the currently active stack frame (the frame pointer). The specific arrangements for an architecture are a key part of the ABI.
A diagram helps to explain this. Here is a simple program to compute factorials:
 1:   #include <stdio.h>
 2:
 3:   int fact( int  n )
 4:   {
 5:     if( 0 == n ) {
 6:       return 1;
 7:     }
 8:     else {
 9:       return n * fact( n - 1 );
10:     }
11:   }
12:
13:   main()
14:   {
15:     int  i;
16:
17:     for( i = 0 ; i < 10 ; i++ ) {
18:       int   f = fact( i );
19:       printf( "%d! = %d\n", i, f );
20:     }
21:   }
Consider the state of the stack when the code reaches line 6 after
the main program has called fact (3). The
chain of function calls will be main,
fact (3),
fact (2),
fact (1) and
fact (0). In this example the stack is
falling (as used by the OpenRISC 1000 ABI). The stack pointer
(SP) is at the end of the stack (lowest address) and the frame
pointer (FP) is at the highest address in the current stack
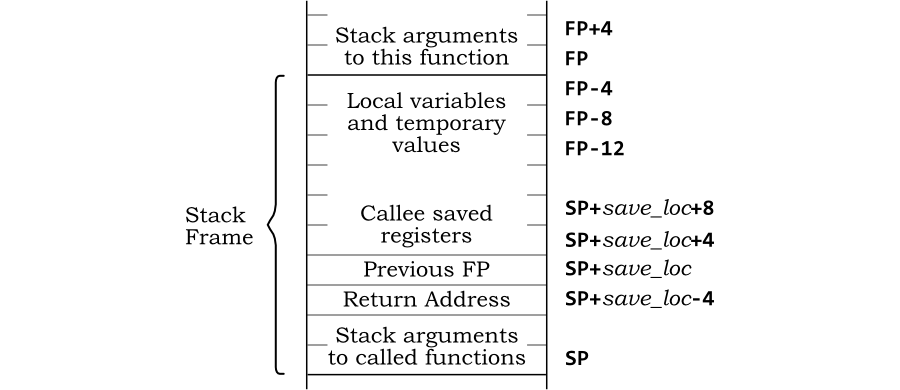
frame. Figure 2.1 shows how the stack looks.
In each stack frame, offset 0 from the stack pointer is the frame
pointer of the previous frame and offset 4
(this is illustrating a 32-bit architecture) from the stack pointer
is the return address. Local variables are indexed from the frame
pointer, with negative indexes. In the function
fact, offset -4 from the frame pointer is the
argument n. In the main
function, offset -4 from the frame pointer is the local variable
i and offset -8 from the frame pointer is the
local variable f.
![[Note]](./images/note.png) | Note |
|---|---|
This is a simplified example for illustrative purposes only. Good optimizing compilers would not put anything on the stack for such simple functions. Indeed they might eliminate the recursion and use of the stack entirely! |
It is very easy to get confused when examining stacks. GDB has
terminology it uses rigorously throughout. The stack frame of the
function currently executing, or where execution stopped is numbered
zero. In this example frame #0 is the stack frame of the call to
fact (0). The stack frame of its calling
function (fact(1) in this case) is numbered #1
and so on back through the chain of calls.
The main GDB data structure describing frames is struct frame_info. It is not used directly, but only via its accessor functions. struct frame_info includes information about the registers in the frame and a pointer to the code of the function with which the frame is associated. The entire stack is represented as a linked list of struct frame_info.
It is easy to get confused when referencing stack frames. GDB uses some precise terminology.
THIS frame is the frame currently under consideration.
The NEXT frame, also sometimes called the inner or newer frame is the frame of the function called by the function of THIS frame.
The PREVIOUS frame, also sometimes called the outer or older frame is the frame of the function which called the function of THIS frame.
So in the example of Figure 2.1, if THIS
frame is #3 (the call to fact (3)), the
NEXT frame is frame #2 (the call to
fact (2)) and the PREVIOUS frame is frame
#4 (the call to main ()).
The innermost frame is the frame of the current
executing function, or where the program stopped, in this example,
in the middle of the call to fact (0)). It
is always numbered frame #0.
The base of a frame is the address immediately before the start of the NEXT frame. For a falling stack this will be the lowest address and for a rising stack this will be the highest address in the frame.
GDB functions to analyze the stack are typically given a pointer to the NEXT frame to determine information about THIS frame. Information about THIS frame includes data on where the registers of the PREVIOUS frame are stored in this stack frame. In this example the frame pointer of the PREVIOUS frame is stored at offset 0 from the stack pointer of THIS frame.
The process whereby a function is given a pointer to the NEXT
frame to work out information about THIS frame is referred to as
unwinding. The GDB functions involved in this
typically include unwind in their name.
The process of analyzing a target to determine the information that
should go in struct frame_info is called
sniffing. The functions that carry this out are
called sniffers and typically include
sniffer in their name. More than one sniffer may
be required to extract all the information for a particular frame.
Because so many functions work using the NEXT frame, there is an issue about addressing the innermost frame—it has no NEXT frame. To solve this GDB creates a dummy frame #-1, known as the sentinel frame.
All the frame sniffing functions typically examine the code at the start of the corresponding function, to determine the state of registers. The ABI will save old values and set new values of key registers at the start of each function in what is known as the function prologue.
For any particular stack frame this data does not change, so all the standard unwinding functions, in addition to receiving a pointer to the NEXT frame as their first argument, receive a pointer to a prologue cache as their second argument. This can be used to store values associated with a particular frame, for reuse on subsequent calls involving the same frame.
It is up to the user to define the structure used (it is a void * pointer) and arrange allocation and deallocation of storage. However for general use, GDB provides struct trad_frame_cache, with a set of accessor routines. This structure holds the stack and code address of THIS frame, the base address of the frame, a pointer to the struct frame_info for the NEXT frame and details of where the registers of the PREVIOUS frame may be found in THIS frame.
Typically the first time any sniffer function is called with
NEXT frame, the prologue sniffer for THIS frame will be
NULL. The sniffer will analyze the frame, allocate a prologue
cache structure and populate it. Subsequent calls using the same
NEXT frame will pass in this prologue cache, so the data can be
returned with no additional analysis.
These struct gdbarch functions and value provide analysis of the stack frame and allow it to be adjusted as required.
skip_prologue. The prologue of a function
is the code at the beginning of the function which sets up the
stack frame, saves the return address etc. The code
representing the behavior of the function starts after the
prologue.
This function skips past the prologue of a function if the program counter is within the prologue of a function. With modern optimizing compilers, this may be a far from trivial exercise. However the required information may be within the binary as DWARF2 debugging information, making the job much easier.
The default value is NULL (not defined). This function
should always be provided, but can take advantage of DWARF2
debugging information, if that is available.
inner_than. Given two frame or stack
pointers, return 1 (true) if the first represents the "inner"
stack frame and 0 (false) otherwise. This is used to determine
whether the target has a rising or a falling stack frame. See
Section 2.3.6 for an explanation of "inner"
frames.
The default value of this function is NULL and it should
always be defined. However for almost all architectures one of
the built-in functions can be used:
core_addr_lessthan (for falling stacks)
or core_addr_greaterthan (for rising
stacks).
frame_align. The architecture may have
constraints on how its frames are aligned. Given a proposed
address for the stack pointer, this function returns a
suitably aligned address (by expanding the stack frame). The
default value is NULL (undefined). This function should be
defined for any architecture where it is possible the stack
could become misaligned. The utility functions
align_down (for falling stacks) and
align_up (for rising stacks) will
facilitate the implementation of this function.
frame_red_zone_size. Some ABIs reserve
space beyond the end of the stack for use by leaf functions
without prologue or epilogue or by exception handlers
(OpenRISC 1000 is in this category). This is known as a
red zone (AMD
terminology). The default value is 0. Set this field if the
architecture has such a red zone.
These functions provide access to key registers and arguments in the stack frame.
unwind_pc and
unwind_sp. These functions are given a
pointer to THIS stack frame (see Section 2.3.6 for how frames are represented) and return the value of the
program counter and stack pointer respectively in the PREVIOUS
frame (i.e. the frame of the function that called this one).
frame_num_args. Given a pointer to THIS
stack frame (see Section 2.3.6 for how frames
are represented), return the number of arguments that are
being passed, or -1 if not known. The default value is NULL
(undefined), in which case the number of arguments passed on
any stack frame is always unknown. For many architectures this
will be a suitable default.
GDB can call functions in the target code (for example by using the call or print commands). These functions may be breakpointed, and it is essential that if a function does hit a breakpoint, commands like backtrace work correctly.
This is achieved by making the stack look as though the function had been called from the point where GDB had previously stopped. This requires that GDB can set up stack frames appropriate for such function calls.
The following functions provide the functionality to set up such "dummy" stack frames.
push_dummy_call. This function sets up a
dummy stack frame for the function about to be
called. push_dummy_call is given the
arguments to be passed and must copy them into registers or
push them on to the stack as appropriate for the ABI. GDB
will then pass control to the target at the address of the
function, and it will find the stack and registers set up just
as expected.
The default value of this function is NULL (undefined). If the
function is not defined, then GDB will not allow the user to
call functions within the target being debugged.
unwind_dummy_id. This is the inverse of
push_dummy_call which restores the stack
and frame pointers after a call to evaluate a function using a
dummy stack frame. The default value is NULL (undefined). If
push_dummy_call is defined, then this
function should also be defined.
push_dummy_code. If this function is not
defined (its default value is NULL), a dummy call will use the
entry point of the target as its return address. A temporary
breakpoint will be set there, so the location must be writable
and have room for a breakpoint.
It is possible that this default is not suitable. It might not be writable (in ROM possibly), or the ABI might require code to be executed on return from a call to unwind the stack before the breakpoint is encountered.
If either of these is the case, then
push_dummy_code should be defined to push
an instruction sequence onto the end of the stack to which the
dummy call should return.
When a program stops, GDB needs to construct the chain of struct frame_info representing the state of the stack using appropriate sniffers.
Each architecture requires appropriate sniffers, but they do not form entries in struct gdbarch, since more than one sniffer may be required and a sniffer may be suitable for more than one struct gdbarch. Instead sniffers are associated with architectures using the following functions.
frame_unwind_append_sniffer is used to
add a new sniffer to analyze THIS frame when given a pointer
to the NEXT frame.
frame_base_append_sniffer is used to add
a new sniffer which can determine information about the base
of a stack frame.
frame_base_set_default is used to specify
the default base sniffer.
These functions all take a reference to struct gdbarch, so they are associated with a specific architecture. They are usually called in the struct gdbarch initialization function, after the struct gdbarch has been set up. Unless a default has been set, the most recently appended sniffer will be tried first.
The main frame unwinding sniffer (as set by
frame_unwind_append_sniffer) returns a
structure specifying a set of sniffing functions:
struct frame_unwind
{
  enum frame_type            type;
  frame_this_id_ftype       *this_id;
  frame_prev_register_ftype *prev_register;
  const struct frame_data   *unwind_data;
  frame_sniffer_ftype       *sniffer;
  frame_prev_pc_ftype       *prev_pc;
  frame_dealloc_cache_ftype *dealloc_cache;
};
The type field indicates the type of frame this
sniffer can handle: normal, dummy (see
push_dummy_call in Section 2.3), signal handler or sentinel. Signal
handlers sometimes have their own simplified stack structure for
efficiency, so may need their own handlers.
unwind_data holds additional information which
may be relevant to particular types of frame. For example it may
hold additional information for signal handler frames.
The remaining fields define functions that yield different types
of information when given a pointer to the NEXT stack frame. Not
all functions need be provided. If an entry is NULL, the next
sniffer will be tried instead.
this_id determines the stack pointer and
function (code entry point) for THIS stack frame.
prev_register determines where the values
of registers for the PREVIOUS stack frame are stored in THIS
stack frame.
sniffer takes a look at THIS frame's
registers to determine if this is the appropriate unwinder.
prev_pc determines the program counter
for THIS frame. Only needed if the program counter is not an
ordinary register (see prev_pc in Section 2.3).
dealloc_cache frees any additional memory
associated with the prologue cache for this frame (see Section 2.3.6.2).
In general it is only the this_id and
prev_register functions that need be defined
for custom sniffers.
The frame base sniffer is much simpler. It is a struct frame_base, which refers to the corresponding struct frame_unwind and provides functions yielding various addresses within the frame.
struct frame_base
{
  const struct frame_unwind *unwind;
  frame_this_base_ftype     *this_base;
  frame_this_locals_ftype   *this_locals;
  frame_this_args_ftype     *this_args;
};
All these functions take a pointer to the NEXT frame as
argument. this_base returns the base address
of THIS frame, this_locals returns the base
address of local variables in THIS frame and
this_args returns the base address of the
function arguments in this frame.
As described above the base address of a frame is the address immediately before the start of the NEXT frame. For a falling stack, this is the lowest address in the frame and for a rising stack it is the highest address in the frame. For most architectures the same address is also the base address for local variables and arguments, in which case the same function can be used for all three entries.
It is worth noting that if it cannot be determined in any other
way (for example by there being a register with the name
"fp"), then the result of the
this_base function will be used as the value
of the frame pointer variable $fp in GDB
The communication with the target is down to a set of target
operations. These operations are held in a struct target_ops,
together with flags describing the behavior of the target. The
struct target_ops elements are defined and documented in
target.h. The sections following describe the
most important of these functions.
GDB has several different types of target: executable files, core dumps, executing processes etc. At any time, GDB may have several sets of target operations in use. For example target operations for use with an executing process (which can run code) might be different from the operations used when inspecting a core dump.
All the targets GDB knows about are held in a stack. GDB walks down the stack to find the set of target operations suitable for use. The stack is organized as a series of strata of decreasing importance: target operations for threads, then target operations suitable for processes, target operations to download remote targets, target operations for core dumps, target operations for executable files and at the bottom target operations for dummy targets. So GDB when debugging a running process will always select target operations from the process_stratum if available, over target operations from the file stratum, even if the target operations from the file stratum were pushed onto the stack more recently.
At any particular time, there is a current
target, held in the global variable
current_target. This can never be NULL—if
there is no other target available, it will point to the dummy target.
target.h defines a set of convenience macros to
access functions and values in the
current_target. Thus
current_target->to_xyz can be accessed as
target_xyz.
Some targets (sets of target operations in a struct target_ops) are set up automatically by GDB—these include the operations to drive simulators (see Section 2.6 and the operations to drive the GDB Remote Serial Protocol (RSP) (see Section 2.7).
Other targets must be set up explicitly by the implementer, using
the add_target function. By far the most common
is the native target for native debugging of the
host. Less common is to set up a non-native target, such as the
JTAG target used with the OpenRISC 1000[1].
A new native target is created by defining a function
_initialize_arch_os_nat for the
architecture, arch and operating system os, in the source file
arch-os-nat.c. A fragment of a makefile
to create the binary from the source is created in the file
config/arch/os.mh with a header giving
any macro definitions etc in
config/arch/nm-os.h (which will be linked
to nm.h at build time).
The _initialize_ function should create a new
struct target_ops and call add_target to add this
target to the list of available targets.
For new native targets there are standard implementations which
can be reused, with just one or two changes. For example the
function linux_trad_target returns a
struct target_ops suitable for most Linux native targets. It may prove
necessary only to alter the description field and the functions to
fetch and store registers.
For a new remote target, the procedure is a little simpler. The
source files should be added to configure.tgt,
just as for the architectural description (see Section 2.3). Within the source file, define a new
function
_initialize_remote_arch to
implement a new remote target, arch.
For new remote targets, the definitions in
remote.c used to implement the RSP provide a
good starting point.
These functions and variables provide information about the target. The first group identifies the name of the target and provides help information for the user.
to_shortname. This string is the name of
target, for use with GDBs target. Setting
to_shortname to foo
means that
target foo will
connect to the target, invoking to_open for
this target (see below).
to_longname. A string giving a brief
description of the type of target. This is printed with the
info target information (see also
to_files_info below).
to_doc. The help text for this target. If the
short name of the target is foo, then the
command help target will print
target foo followed by
the first sentence of this help text. The command
help target foo
will print out the complete text.
to_files_info. This function provides
additional information for the info target
command.
The second group of variables provides information about the current state of the target.
to_stratum. An enumerated constant indicating
to which stratum this struct target_ops belongs
to_has_all_memory. Boolean indicating if the
target includes all of memory, or only part of it. If only part,
then a failed memory request may be able to be satisfied by a
different target in the stack.
to_has_memory. Boolean indicating if the
target has memory (dummy targets do not)
to_has_stack. Boolean indicating if the
target has a stack. Object files do not, core dumps and
executable threads/processes do.
to_has_registers. Boolean indicating if the
target has registers. Object files do not, core dumps and
executable threads/processes do.
to_has_execution. Boolean indicating if the
target is currently executing. For some targets that is the same
as if they are capable of execution. However some remote targets
can be in the position where they are not executing until
create_inferior or
attach is called.
These functions control the connection to the target. For remote targets this may mean establishing and tearing down links using protocols such as TCP/IP. For native targets, these functions will be more concerned with setting flags describing the state.
to_open. This function is invoked by the
GDB target command. Any additional
arguments (beyond the name of the target being invoked) are
passed to this function. to_open should
establish the communications with the target. It should
establish the state of the target (is it already running for
example), and initialize data structures appropriately.
This function should not start the target
running if it is not currently running—that is the job of
the functions (to_create_inferior and
to_resume) invoked by the GDB
run command.
to_xclose and
to_close. Both these functions should close
the remote connection. to_close is the
legacy function. New implementations should use
to_xclose which should also free any memory
allocated for this target.
to_attach. For targets which can run
without a debugger connected, this function attaches the
debugger to a running target (which should first have been
opened).
to_detach. Function to detach from a
target, leaving it running.
to_disconnect. This is similar to
to_detach, but makes no effort to inform
the target that the debugger is detaching. It should just drop
the connection to the target.
to_terminal_inferior. This function
connects the target's terminal I/O to the local terminal. This
functionality is not always available with remote targets.
to_rcmd. If the target is capable of
running commands, then this function requests that command to be
run on the target. This is of most relevance to remote targets.
These functions transfer data to and from the target registers and memory.
to_fetch_registers and
to_store_registers. Functions to populate
the register cache with values from the target and to set target
registers with values in the register cache.
to_prepare_to_store. This function is
called prior to storing registers to set up any additional
information required. In most cases it will be an empty function.
to_load. Load a file into the target. For
most implementations, the generic function,
generic_load, which is reuses the other
target operations for memory access is suitable.
to_xfer_partial. This function is a generic
function to transfer data to and from the target. Its most
important function (often the only one actually implemented) is
to load and store data from and to target memory.
For all targets, GDB can implement breakpoints and write access watchpoints in software, by inserting code in the target. However many targets provide hardware assistance for these functions which is far more efficient, and in addition may implement read access watchpoints.
These functions in struct target_ops provide a mechanism to access such functionality if it is available.
to_insert_breakpoint and
to_remove_breakpoint. These functions
insert and remove breakpoints on the target. They can choose to
use either hardware or software breakpoints. However if the
insert function allows use of hardware breakpoints, then the
GDB command
set breakpoint auto-hw off
will have no effect.
to_can_use_hw_breakpoint. This function
should return 1 (true) if the target can set a hardware
breakpoint or watchpoint and 0 otherwise. The function is passed
an enumeration to indicate whether watchpoints or breakpoints
are being queried, and should use information about the number
of hardware breakpoints/watchpoints currently in use to
determine if a breakpoint/watchpoint can be set.
to_insert_hw_breakpoint and
to_remove_hw_breakpoint. Functions to
insert and remove hardware breakpoints. Return a failure result
if no hardware breakpoint is available.
to_insert_watchpoint and
to_remove_watchpoint. Functions to insert
and remove watchpoints.
to_stopped_by_watchpoint. Function returns
1 (true) if the last stop was due to a watchpoint.
to_stopped_data_address. If the last stop
was due to a watchpoint, this function returns the address of
the data which triggered the watchpoint.
for targets capable of execution, these functions provide the mechanisms to start and stop execution.
to_resume. Function to tell the target to
start running again (or for the first time).
to_wait. Function to wait for the target to
return control to the debugger. Typically control returns when
the target finishes execution or hits a breakpoint. It could
also occur if the connection is interrupted (for example by
ctrl-C).
to_stop. Function to stop the
target—used whenever the target is to be interrupted (for
example by ctrl-C).
to_kill. Kill the connection to the
target. This should work, even if the connection to the target
is broken.
to_create_inferior. For targets which can
execute, this initializes a program to run, ready for it to
start executing. It is invoked by the GDB
run command, which will subsequently call
to_resume to start execution.
to_mourn_inferior. Tidy up after execution
of the target has finished (for example after it has exited or
been killed). Most implementations call the generic function,
generic_mourn_inferior, but may do some
additional tidying up.
[1] For a new remote target of any kind, the recommended approach is to use the standard GDB Remote Serial Protocol (RSP) and have the target implement the server side of this interface. The only remote targets remaining are historic legacy interfaces, such as the OpenRISC 1000 Remote JTAG Protocol.
As noted in Section 2.2, GDB's command
handling is extensible. Commands are grouped into a number of command
lists (of type struct cmd_list_element),
pointed to by a number of global variables (defined in
cli-cmds.h). Of these, cmdlist
is the list of all defined commands, with separate lists defined for
sub-commands of various top level commands. For example
infolist is the list of all info
sub-commands.
Each command (or sub-command) is associated with a callback function which implements the behavior of the functions. There are additional requirements for functions which set or show values within GDB. Each function also takes a documentation string (used by the help command). Functions for adding commands all return a pointer to the struct cmd_list_element for the command added (which is not necessarily the head of its command list). The most useful functions are:
add_cmd. Add a function to a command list.
add_com. Add a function to the main command
list, cmdlist. This is a convenience wrapper
for add_cmd.
add_prefix_cmd. Add a new prefix
command. This command should have its own function for use if it
is called on its own, and a global command list pointer specific
to the prefix command to which all its sub-commands will be
added. If a prefix command is called with an unknown sub-command,
it can either give an error or call the function of the prefix
command itself. Which of these is used is specified by a flag in
the call to add_prefix_cmd.
add_alias_cmd. Add an alias for a command
already defined.
add_info. Add a sub-command to the
info. A convenience wrapper for
add_cmd.
New commands are usually added in the
_initialize_arch function after the struct gdbarch
has been defined.
GDB enables implementers to link gdb to a built-in simulator, so that a simulated target may be executed through use of the target sim command.
The simulator should be built as a library,
libsim.a, implementing the standard GDB
simulator interface. The location of the library is specified by
setting the gdb_sim parameter in
configure.tgt.
The interface consists of a set of functions which should be
implemented. The detailed specification is found in the header
remote-sim.h in the include directory.
sim_open. Initialize the simulator.
sim_close. Destroy the simulator instance,
including freeing any memory.
sim_load. Load a program into the simulator's
memory.
sim_create_inferior. Prepare to run the
simulated program. Don't actually run it until
sim_resume (see below) is called.
sim_read and
sim_write. Read and write bytes from and to
the simulator's memory.
sim_fetch_register and
sim_store_register. Read and write the
simulator's registers.
sim_info. Print information for the
info sim command.
sim_resume. Resume (or start) execution of
the simulated program.
sim_stop. Stop execution of the simulated
program.
sim_stop_reason. Return the reason why the
program stopped.
sim_do_command. Execute some arbitrary
command that the simulator supports.
The GDB Remote Serial Protocol is a general purpose protocol for connecting to remote targets. It is invoked through the target remote and target extended-remote commands.
The protocol is a simple text command-response protocol. The GDB session acts as the client to the protocol. It issues commands to the server, which in turn must be implemented by the target. Any remote target can communicate with GDB by implementing the server side of the RSP. A number of stub implementations are provided for various architectures, which can be used as the basis of new implementations. The protocol is fully documented as an appendix within the main GDB User Guide [3].
It is strongly recommended that any new remote target should be implemented using the RSP, rather than by creating a new remote target protocol.
The client implementation can be found in the source files
remote.h and remote.c in
the gdb subdirectory. These implement a set of
target operations, as described in Section 2.4. Each of the standard operations is
mapped into a sequence of RSP interactions with the server on the
target.
RSP server implementation is a large subject in its own right, and does not form a direct part of the GDB implementation (since it is part of the target, not the debugger).
A comprehensive "Howto" has been written by Embecosm, describing the implementation techniques for RSP servers, illustrated by examples using the OpenRISC 1000 architectural simulator, Or1ksim as RSP target [2].
The bulk of the GDB source code is in a small number of directories. Some components of GDB are libraries used elsewhere (for example BFD is used in GNU binutils), and these have their own directory. The main directories are:
include. Header files for information which
straddles major components. For example the main simulator
interface header is here (remote-sim.h),
because it links GDB (in directory gdb) to
the simulators (in directory sim). Other
headers, specific to a particular component reside in the
directory of that component.
bfd. The Binary File Descriptor library. If a
new object file type must be recognized, it should be added here.
gdb. The main GDB directory. All source
files should include defs.h first and then
any other headers they reference. Headers should also include any
headers they reference, but may assume that
defs.h has been included.
The file configure.tgt contains a huge switch
statement to match targets specified to the main
configure command. Add a new target by
incorporating its pattern match in this file.
The sub-directory config contains target
specific configuration information for native targets.
libiberty. Before POSIX and glibc, this was a GNU project to provide a set of standard functions. It lives on in GDB. Most valuable are its free store management and argument parsing functions.
opcodes. This contains disassemblers for use
by GDB (the disassemble command);. In a
directory of its own, because this code is also used in
binutils.
sim. The simulators for various targets. Each
target architecture simulator is built in its own sub-directory.
Running the GDB test suite requires that the DejaGNU package is installed. The tests can then be run with:
make check
On completion of the run, the summary results will be in the
gdb/testsuite directory in
gdb.sum with the detailed log in
gdb.log
For the most comprehensive tests in an environment where host and
target differ, DejaGNU needs some
additional configuration. This can be achieved by setting the
DEJAGNU environment variable to refer to a
suitable configuration file, and defining a custom board configuration
file in the directory ~/boards. These
configuration files can be used to specify a suitable simulator and
how to connect it when running tests.
Some of GDB sub-directories in turn have doc
sub-directories. The documentation is written in
texinfo [9],
from which documents can be generated as PDF, PostScript, HTML or
info files. The documentation is not built
automatically with make all, nor with
make doc.
To create documentation, change to the individual documentation directory and use make html, make pdf, make ps or make info as required.
The main documents of interest are:
The exception to automatic building is with
make install. This will build
info files for any documents in the
gdb/doc directory and install them in the
info sub-directory of the install directory.
It is instructive to see how the architecture specification functions and target operations are invoked in response to various GDB commands. This gives useful points for debugging a new architecture port.
In the following sections, several procedure flows are illustrated by sequence diagrams. These show the calling chain for procedures. Only the key functions are shown - the actual calls usually involve several intermediate function calls.
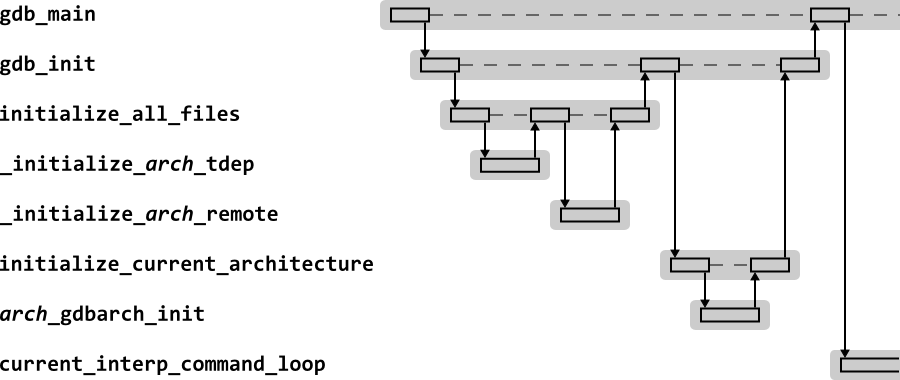
Figure 2.2 shows the sequence diagram for GDB start up.
On start up, the GDB initialization function,
gdb_init calls all the
_initialize functions, including those for any
architectures or remote targets.
Having initialized all the architectures, the first alphabetically
is selected as the default architecture by
initialize_current_architecture, and its
initialization function, (by convention
arch_gdbarch_init) is called.
Control returns to gdb_main, which sits in the
command interpreter, waiting for commands to execute.
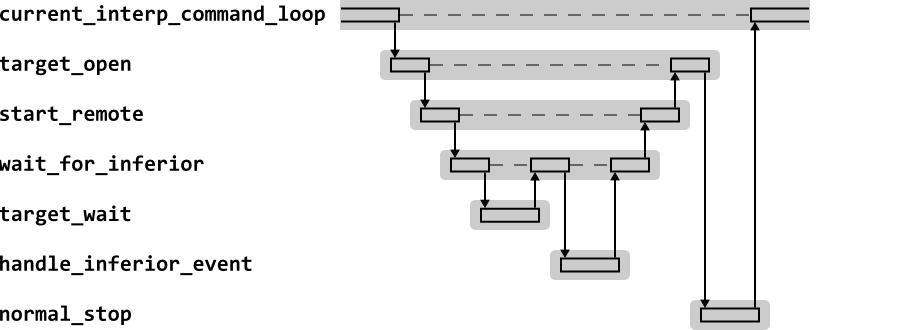
Figure 2.3 shows the high level sequence diagram for GDB in response to the target command.
The target command maps directly on to the
current target to_open. A typical
implementation establishes physical connection to the target (for
example by opening a TCP/IP link to a remote target). For a remote
target, it then typically calls start_remote,
which waits for the target to stop (using the current target
to_wait function), determines the reason for
stopping (handle_inferior_event) and then marks
this as a normal stop (normal_stop).
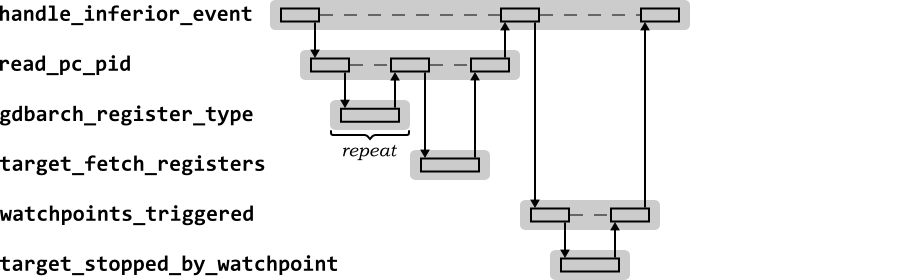
handle_inferior_event is a central function in
GDB. Whenever control is returned to GDB, via the target
to_wait function, it must determine what has
happened and how it should be handled. Figure 2.4 shows the behavior of
handle_inferior_event in response to the
target command.
handle_inferior_event needs to establish the
program counter at which execution stopped, so calls
read_pc_pid. Since the program counter is a
register, this causes creation of a register cache, for which the
type of each register must be determined by
gdbarch_register_type (a one-off exercise,
since this never changes). Having determined register types, the
register cache is populated with the value of the program counter by
calling the current target to_fetch_registers
for the relevant register.
handle_inferior_event then determines if the
stop was due to a breakpoint or watchpoint. The function
watchpoints_triggered uses the target
target_stopped_by_watchpoint to determine if it
was a watchpoint which triggered the stop.
The call to normal_stop also invokes the
struct gdbarch functions, calling gdbarch_unwind_pc
to establish the current program counter and and frame sniffer
functions to establish the frame sniffer stack.
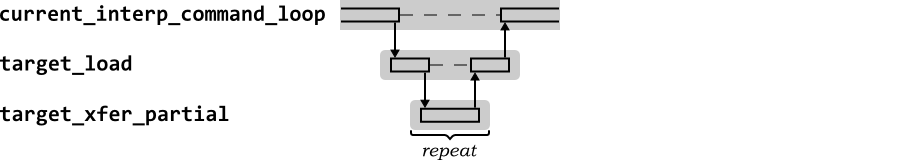
Figure 2.5 shows the high level sequence
diagram for GDB in response to the load
command. This maps to the current target's
to_load function, which in most cases will end
up calling the current target's to_xfer_partial
function once for each section of the image to load it into memory.
The load function will capture data from the loaded file, most importantly its start address for execution.
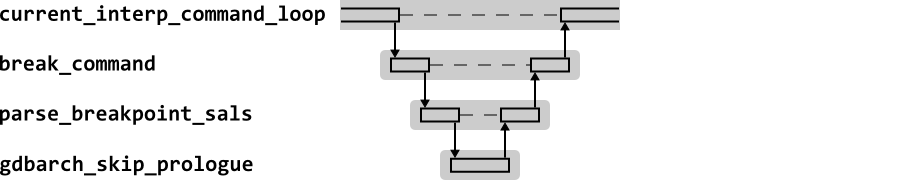
Figure 2.6 shows the high level sequence diagram for GDB in response to the break command. This example is for the case where the target of the break is a symbol (i.e. a function name) in the target executable.
Most of the action with breakpoints occurs when the program is set running, at which any active breakpoints are installed. However for any break command, the address for the break must be set up in the breakpoint data structure.
For symbolic addresses, the start of the function can be obtained
from the line number information held for debugging purposes in the
symbol table (known as symbol-and-line
information, or SAL). For a function, this will yield the start
address of the code. However the breakpoint must be set after the
function prologue. gdbarch_skip_prolog is used to
find that address in the code.
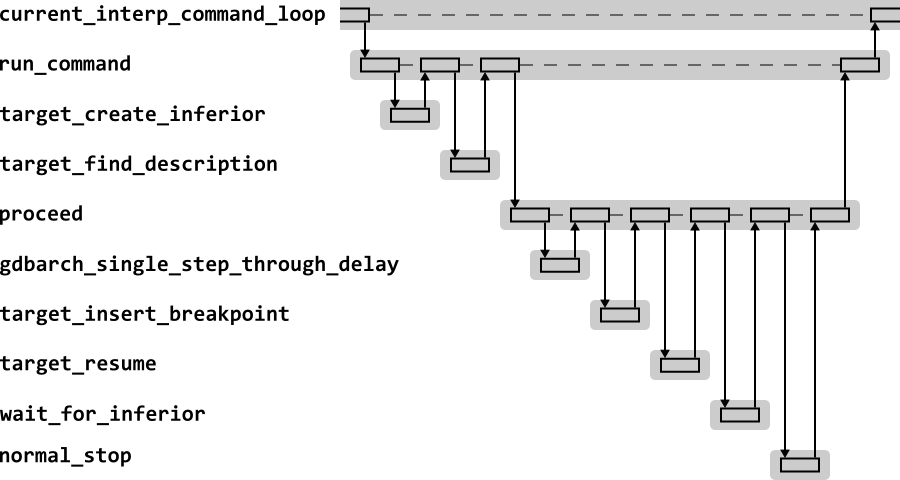
Figure 2.7 shows the high level sequence diagram for GDB in response to the run command.
The run command must create the inferior, insert any active breakpoints and watchpoints, and then start execution of the inferior. Control does not return to GDB until the target reports that it has stopped.
The top level function implementing the run
command is run_command. This creates the
inferior, but calling the current target's
to_create_inferior function. GDB supports
targets which can give a dynamic description of their architecture
(for example the number of registers available). This is achieved
through the to_find_description function of the
current target (which is an empty function by default).
Execution is started by the proceed. This must
first determine if the code is restarting on an instruction which
will need stepping through a delay slot (so that code never stops on
a delay slot). If this functionality is required, it is implemented
by the gdbarch_single_sep_through_delay
function.
Active breakpoints are inserted using the current target's
to_insert_breakpoint function. The code is then
run using the to_resume function of the current
target.
GDB then calls wait_for_inferior, which will
wait for the target to stop, and then determine the reason for the
stop. Finally normal_stop will remove the
breakpoints from the target code and report to the user the current
state of the target as appropriate.
Much of the detailed processing takes place in the
wait_for_inferior and
normal_stop functions (see also their use in
Section 2.11.2). These are important functions
and it is useful to look at their behavior in more detail.
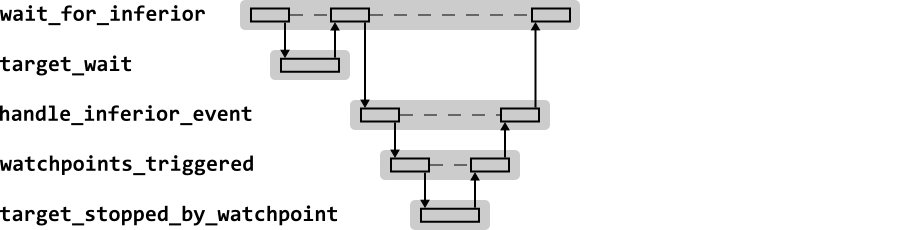
Figure 2.8 shows the sequence
diagram for wait_for_inferior when handling the
GDB run command.
Once again the key work is in
handle_inferior_event. The code checks for
watchpoints using the to_stopped_by_watchpoint
function of the current target. The function also checks
breakpoints, but since it already knows the current program counter
(set by target_wait when control is returned),
it needs no further call to the target
operations. target_wait will have reported if
it stopped due to an exception that could be due to a
breakpoint. handle_inferior_event can then look
up the program counter in the list of active breakpoints, to
determine which breakpoint was encountered.
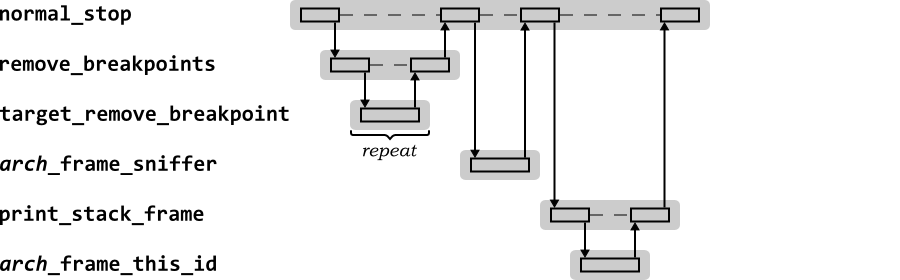
Figure 2.9 shows the sequence
diagram for normal_stop when handling the
GDB run command. In this example the stop was
due to the target encountering a breakpoint.
The first action is to remove breakpoints. This ensures that the target executable is returned to its normal state, without any trap or similar code inserted.
The frame sniffers for the target are identified, using the frame
sniffer for the architecture,
arch_frame_sniffer. The current stack frame
is then printed for the user. This requires use of the frame sniffer
to identify the ID (and hence all the other data) of THIS frame
from the NEXT frame (arch_frame_this_id
here). print_stack_frame will start from the
sentinel frame and work inwards until it finds the stack frame
containing the current stack pointer and program counter.
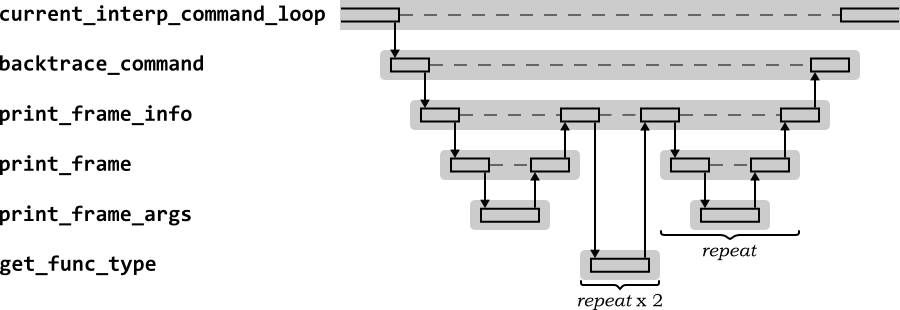
Figure 2.10 shows the high level sequence diagram for GDB in response to the backtrace command. This sequence shows the behavior for the first call to backtrace after control has returned to GDB.
The main command function is backtrace_command,
which uses print_frame_info to print the name
of each function on the stack with its arguments.
The first frame is already known from the program counter and stack
pointer of the stopped target, so is printed out by
print_frame. That will ultimately use the
current target's to_xfer_partial function to
get the local argument values.
Since this is the first backtrace after the
program stopped, the stack pointer and program counter are each
obtained from the sentinel frame using
get_func_type. print_frame
is then called for each frame in turn as the stack is unwound until
there are no more stack frames. The information in each frame is
built up using the architecture's frame sniffers.
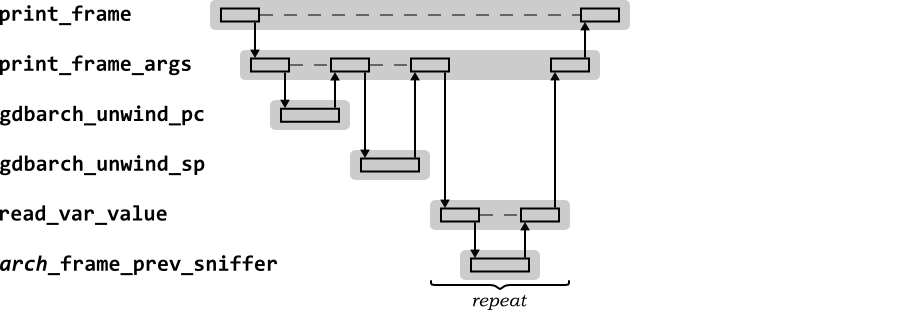
It is useful to look at print_frame in more
detail. Figure 2.11 shows the
sequence diagram for the second series of calls to the
print_frame function when handling the GDB
backtrace command, used to print out the stack
frame.
The information about the function on the stack frame can be
obtained from the program counter and stack pointer associated with
the stack frame. These are obtained by calls to the
gdbarch_unwind_pc and
gdbarch_unwind_sp functions.
Then for each argument, its value must be printed out. The symbol
table debug data will identify the arguments, and enough information
for GDB to work out if the value is on the stack or in a
register. The frame sniffer function to get registers from the stack
frame (in this example
arch_frame_prev_register) is used to get the
values of any registers as appropriate.
The precise sequence of calls depends on the functions in the stack frame, the arguments they have, and whether those arguments are in registers or on the stack.
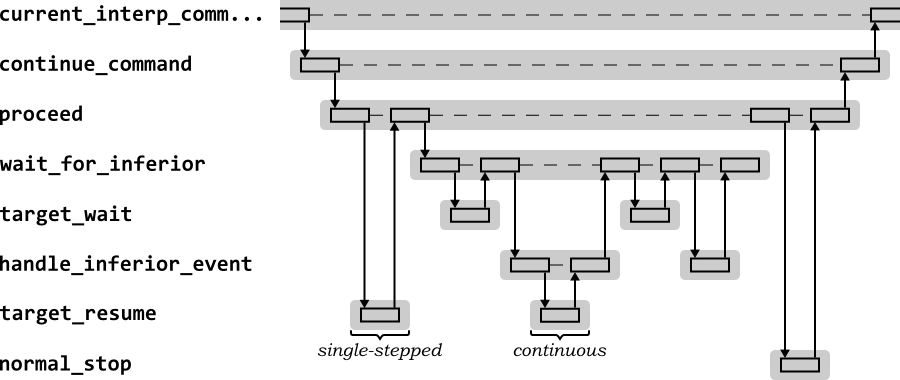
The final sequence shows the behavior when execution is resumed after a breakpoint with the continue command. Figure 2.12 shows the high level sequence diagram for GDB in response to the continue command. This sequence shows the behavior for the first call to continue after a run stopped due to a breakpoint.
The command functionality is provided by the
continue_command, which calls the
proceed function for much of its behavior.
proceed calls the
to_resume function of the current target to
resume execution. For this first call, the breakpoint(s) removed
when execution completed after the run command
are not replaced and the target resumption is
only for a single instruction step. This allows the target to be
stepped past the breakpoint without triggering an exception.
proceed then uses
wait_for_inferior to wait for control to return
after the single step and diagnose the next action. Waiting uses the
to_wait function of the current target, then
calls handle_inferior_event to analyze the
result. In this case, handle_inferior_event
determines that a target has just stepped past a breakpoint. It
reinserts the breakpoints and calls the target
to_resume function again, this time to run
continuously.
wait_for_inferior will use the current target
to_wait function again to wait for the target
to stop executing, then again call the
handle_inferior_event to process the
result. This time, control should return to GDB, so breakpoints
are removed, and handle_inferior_event and
wait_for_inferior
return. proceed calls
normal_stop to tidy up and print out a message
about the current stack frame location where execution has stopped
(see Section 2.11.5.).
It is useful to examine the behavior of the first call to
handle_inferior_event, to see the sequence for
completing the single step and resuming continuous execution. Figure 2.13 shows the sequence
diagram for the first call to
handle_inferior_event.
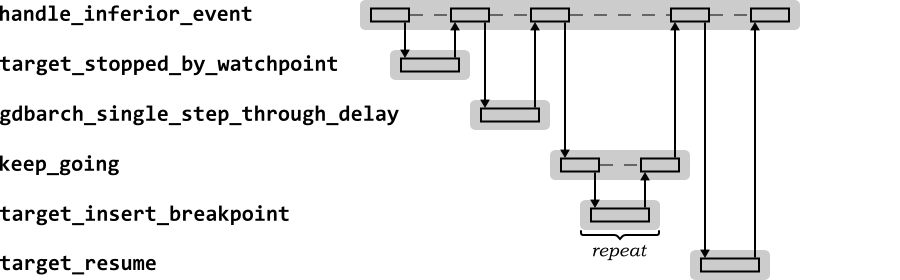 |
Figure 2.13.
Sequence diagram for the GDB
handle_inferior_event function after single
stepping an instruction for the continue
command
handle_inferior_event first determines if a
watchpoint has now been triggered. If this is not the case, it
checks if the processor is now in the delay slot of an instruction
(requiring another single-step immediately). Having determined that
continuous execution is appropriate, it calls the function
keep_going to reinsert active breakpoints
(using the to_insert_breakpoint function of the
current target). Finally it calls the to_resume
function of the current target without the single-step
flag set to resume continuous execution.
Porting a new architecture to GDB can be broken into a number of steps.
Ensure a BFD exists for executables of the target architecture
in the bfd directory. If one does not exist,
create one by modifying an existing similar one.
Implement a disassembler for the target architecture in the
opcodes directory.
Define the target architecture in the gdb
directory. Add the pattern for the new target to
configure.tgt with the names of the files
that contain the code. By convention the target architecture
definition for an architecture arch is placed
in arch-tdep.c.
Within arch-tdep.c define the function
_initialize_arch_tdep which calls
gdbarch_register to create the new struct gdbarch
for the architecture.
If a new remote target is needed, consider adding a new remote
target by defining a function
_initialize_remote_arch.
However if at all possible use the Remote Serial
Protocol for this and implement the server side
protocol independently with the target.
If desired implement a simulator in the sim
directory. This should create the library
libsim.a implementing the interface in
remote-sim.h (found in the
include directory).
Build and test. If desired, lobby the GDB steering group to have the new port included in the main distribution!
Add a description of the new architecture to the "Configuration
Specific Information" section in the main GDB user guide
(gdb/doc/gdb.texinfo [3]).
The remainder of this document shows how this process was used to port GDB to the OpenRISC 1000 architecture.
The OpenRISC 1000 architecture defines a family of free, open source RISC processor cores. It is a 32 or 64-bit load and store RISC architecture designed with emphasis on performance, simplicity, low power requirements, scalability and versatility.
The OpenRISC 1000 is fully documented in its Architecture Manual [8].
From a debugging perspective, there are three data areas that are manipulated by the instruction set.
Main memory. A uniform address space with 32 or 64-bit addressing. Provision for separate or unified instruction and data and instruction caches. Provision for separate or unified, 1 or 2-level data and instruction MMUs.
General Purpose Registers (GPRs). Up to 32 registers, 32 or 64-bit in length.
Special Purpose Registers (SPRs). Up to 32 groups each with up to 2048 registers, up to 32 or 64-bit in length. These registers provide all the administrative functionality of the processor: program counter, processor status, saved exception registers, debug interface, MMU and cache interfaces, etc.
The Special Purpose Registers (SPRs) represent a challenge for GDB, since they represent neither addressable memory, nor have the characteristics of a register set (generally modest in number).
A number of SPRs are of particular significance to the GDB implementation.
Configuration registers. The Unit Present
register (SPR 1, UPR), CPU Configuration
register (SPR 2, CPUCFGR) and Debug
Configuration register (SPR 7, DCFGR)
identify the features available in the particular OpenRISC 1000
implementation. This includes the instruction set in use, number of
general purpose registers and configuration of the hardware debug
interface.
Program counters. The Previous Program Counter
(SPR 0x12, PPC) is the address of the
instruction just executed. The Next Program Counter (SPR 0x10,
NPC) is the address of the next instruction to be
executed. The NPC is the value reported by GDBs
$pc variable.
Supervision Register. The supervision register
(SPR 0x11, SR) represents the current status
of the processor. It is the value reported by GDBs status register
variable, $ps.
Of particular importance are the SPRs in group 6 controlling the debug unit (if present). The debug unit can trigger a trap exception in response to any one of up to 10 watchpoints. Watchpoints are logical expressions built by combining matchpoints, which are simple point tests of particular behavior (has a specified address been accessed for example).
Debug Value and Control registers. There are up
to 8 pairs of Debug Value (SPR 0x3000–0x3007,
DVR0 through DVR7) and
Debug Control (SPR 0x3008–0x300f,
DCR0 through DCR7)
registers. Each pair is associated with one hardware
matchpoint. The Debug Value register in each
pair gives a value to compare against. The Debug Control register
indicates whether the matchpoint is enabled, the type of value to
compare against (instruction fetch address, data load and/or store
address data load and/or store value) and the comparison to make
(equal, not equal, less than, less than or equal, greater than,
greater than or equal), both signed and unsigned. If the matchpoint
is enabled and the test met, the corresponding matchpoint is
triggered.
Debug Watchpoint counters. There are two 16-bit
Debug Watchpoint Counter registers (SPR 0x3012–0x3013,
DWCR0 and DWCR1), associated
with two further matchpoints. The upper 16 bits are a value to
match, the lower 16 bits a counter. The counter is incremented when
specified matchpoints are triggered (see Debug Mode register
1). When the count reaches the match value, the corresponding
matchpoint is triggered.
![[Caution]](./images/caution.png) | Caution |
|---|---|
There is potential ambiguity in that counters are incremented in response to matchpoints and also generate their own matchpoints. It is not good practice to set a counter to increment on its own matchpoint! |
Debug Mode registers. There are two Debug Mode
registers to control the behavior of the the debug unit
(SPR 0x3010–0x3011, DMR1 and
DMR2). DMR1 provides a pair of
bits for each of the 10 matchpoints (8 associated with DVR/DCR
pairs, 2 associated with counters). These specify whether the
watchpoint is triggered by the associated matchpoint, by the
matchpoint AND-ed with the previous watchpoint or by the matchpoint
OR-ed with the previous watchpoint. By building chains of
watchpoints, complex logical tests of hardware behavior can be built
up.
Two further bits in DMR1 enable single step
behavior (a trap exception occurs on completion of each instruction)
and branch step behavior (a trap exception occurs on completion of
each branch instruction).
DMR2 contains an enable bit for each counter, 10
bits indicating which watchpoints are assigned to which counter and 10
bits indicating which watchpoints generate a trap exception. It also
contains 10 bits of output, indicating which watchpoints have
generated a trap exception.
Debug Stop and Reason registers. In normal
operation, all OpenRISC 1000 exceptions are handled through the
exception vectors at locations 0x100 through 0xf00. The Debug Stop
register (SPR 0x3014, DSR) is used to
assign particular exceptions instead to the JTAG interface. These
exceptions stall the processor, allowing the machine state to be
analyzed through the JTAG interface. Typically a debugger will
enable this for trap exceptions used for breakpointing.
Where an exception has been diverted to the development interface,
the Debug Reason register (SPR 0x3021,
DRR) indicates which exception caused the
diversion. Note that although single stepping and branch stepping
cause a trap, if they are assigned to the JTAG interface, they
do not set the TE bit in the
DRR. This allows an external debugger to
distinguish between breakpoint traps and single/branch step traps.
There are two variants of the JTAG interface for use with the OpenRISC 1000.
The original JTAG interface was created as part of the OpenRISC SoC project, ORPSoC [10]. It provides three scan chains: one to access to all the SPRs, one to access external memory and one providing control of the CPU. The control scan chain reset, stall or trace the processor.
A new JTAG interface was provided by Igor Mohor in 2004 [11]. It provides the same access to SPRs and external memory, but offers a simpler control interface offering only the ability to stall or reset the processor.
At present the OpenRISC Architectural Simulator, Or1ksim, (see Section 3.4) supports the first of these interfaces.
Three scan chains are provided by both interfaces
RISC_DEBUG (scan chain 1), providing read/write access to the SPRs.
REGISTER (scan chain 4), providing control of the CPU. In the
ORPSoC interface, this provides multiple registers which are read
and written to control the CPU. Of these register 0,
MODER, which controls hardware trace, and
register 4, RISC_OP, which controls reset and
stall are the most important. Trace is enabled by setting, and
disabled by clearing bit 1 in MODER. Reset
and processor stall are triggered and cleared by setting and
clearing respectively bit 1 and bit 0 in
RISC_OP. The stall state may be determined by
reading the stall bit in RISC_OP.
In the Mohor interface, there is a single control register which
behaves identically to RISC_OP in the original
debug interface.
WISHBONE (scan chain 5), providing read/write access to main memory.
Since the General Purpose Registers (GPRs) are mapped to SPR group 0, this mechanism also allows GPRs to be read and written.
![[Important]](./images/important.png) | Important |
|---|---|
The latest version of GDB for OpenRISC 1000 implements the GDB Remote Serial Protocol, which is the preferred mechanism for connecting to remote targets [2]. However the protocol described here is retained for backward compatibility. It is used here as a tutorial vehicle to illustrate how a custom debugging protocol can be used within GDB |
To facilitate remote debugging by GDB, the OpenRISC defines a software protocol describing JTAG accesses, suitable for transport over TCP/IP via a socket interface.
| Note |
|---|---|
This protocol pre-dates the GDB Remote Serial Protocol (see Section 2.7). At some future date the OpenRISC 1000 Remote JTAG Protocol will be replaced by the RSP. |
The OpenRISC 1000 Remote JTAG Protocol is a simple message send/acknowledge protocol. The JTAG request is packaged as a 32 bit command, 32-bit length and series of 32-bit data words. The JTAG response is packaged as a 32-bit status and optionally a number of 32-bit data words. The commands available are:
OR1K_JTAG_COMMAND_READ (1). Read a single
JTAG register. A 32-bit address is provided in the request. The
response includes 64-bits of read data.
OR1K_JTAG_COMMAND_WRITE (2). Write a single
JTAG register. A 32-bit address is provided in the
request and 64-bit data to be written.
OR1K_JTAG_COMMAND_READ_BLOCK (3). Read
multiple 32-bit JTAG registers. A 32-bit address of the first
register and number of registers to be read is provided in the
request. The response includes the number of registers read and
32-bits of data for each one read.
OR1K_JTAG_COMMAND_WRITE_BLOCK (4). Write
multiple 32-bit JTAG registers. A 32-bit address of the first
register and number of registers to be written is provided in the
request followed by 32-bits of data to be written for each
register.
OR1K_JTAG_COMMAND_CHAIN (5). Select the scan
chain. A 32-bit scan chain number is provided in the request.
Where the Mohor version of the JTAG interface is being used,
addresses for read/write accesses to the REGISTER
scan chain are ignored—there is only one control register.
| Note |
|---|---|
There is apparently a contradiction in this protocol. Provision is made for individual registers to be read/written as 64 bits, whereas block read/writes (provided for communication efficiency) are only 32-bits. |
Figure 3.1 shows the structures of all five requests and their corresponding (successful) responses. Note that if a request fails, the response will only contain the status word.
The client side of this protocol (issuing the requests) is implemented by the GDB port for OpenRISC 1000.
Server side applications may implement this protocol to drive either physical hardware (via its JTAG port) or simulations, which include the JTAG functionality. Examples of the former include USB JTAG connectors, such as those produced by ORSoC™ AB. An example of the latter is the OpenRISC 1000 Architectural Simulator, Or1ksim (see Section 3.4).
The ABI for the OpenRISC 1000 is described in Chapter 16 of the Architecture Manual [8]. However the actual GCC compiler implementation differs very slightly from the documented ABI. Since precise understanding of the ABI is critical to GDB, those differences are documented here.
Register Usage: R12 is used as another callee-saved register. It is never used to return the upper 32 bits of a 64-bit result on a 32-bit architecture. All values greater than 32-bits are returned by a pointer.
Although the specification requires stack frames to be double word aligned, the current GCC compiler implements single word alignment.
Integral values more than 32 bits (64 bits on 64-bit architectures), structures and unions are returned as pointers to the location of the result. That location is provided by the calling function, which passes it as a first argument in GPR 3. In other words, where a function returns a result of this type, the first true argument to the function will appear in R4 (or R5/R6 if it is a 64-bit argument on a 32-bit architecture).
Or1ksim is an instruction set simulator (ISS) for the OpenRISC 1000 architecture. At present only the 32-bit architecture is modeled. In addition to modeling the core processor, Or1ksim can model a number of peripherals, to provide the functionality of a complete System-on-Chip (SoC).
Or1ksim models the OpenRISC 1000 JTAG interface and implements the OpenRISC 1000 Remote JTAG protocol server side. It was used as the testbed for this port of GDB
The JTAG interface models the behavior of the old ORPSoC (with support for multiple control registers and hardware trace). A future release will provide an option to support Igor Mohor's JTAG interface.
| Note |
|---|---|
Porting GDB uncovered a number of bugs in Or1ksim. The implementation is now quite old, and predates the current OpenRISC 1000 specification. A patch (available from www.embecosm.com/download/index.html) is available to fix these bugs. |
This chapter describes the steps in porting the OpenRISC 1000 architecture to GDB. It uses the information and data structures described in Chapter 2.
The OpenRISC 1000 version of GDB is documented briefly in the GDB
User Guide [3]. A more comprehensive
tutorial [6] is provided within the
gdb/doc sub-directory in the file
or1k.texinfo.
Strictly speaking this was not a new port. An old port existed for GDB 5.3. However GDB has changed substantially since that time, and an almost complete reimplementation was required.
The BFD specification for OpenRISC 1000 already existed (it is part of binutils), so there was no need to implement this. The existing code is just reused.
The code resides in the gdb sub-directory. The
main architectural specification is in
or1k-tdep.c, with and OpenRISC 1000 wide header
in or1k-tdep.h. Support for the OpenRISC 1000
Remote JTAG interface is in remote-or1k.c with
the detailed protocol in or1k-jtag.c and a
protocol header in or1k-jtag.h.
There are several targets which can use the OpenRISC 1000
architecture. These all begin or16,
or32 or or32. The
configure.tgt is edited to add patterns for these
that will pick up the binaries generated from these source files.
or16* | or32* | or64*)
        # Target: OpenCores OpenRISC 1000 architecture
        gdb_target_obs="or1k-tdep.o remote-or1k.o or1k-jtag.o"
        ;;
The architecture definition is created from the
_initialize_or1k_tdep by a call to
gdbarch_register. That function also initializes
the disassembler (build_automata) and adds two
new commands: a sub-command to the info command to
read SPRs and a new top level support command,
spr to set the value of SPRs.
gdbarch_register is called for BFD type
bfd_arch_or32 with the initialization function
or1k_gdbarch_init and the target specific dump
function, or1k_dump_tdep.
Future implementations may make additional calls to use the same function to create a 64-bit version of the architecture.
gdbarch_init receives the struct gdbarch_info
created from the BFD entries and the list of existing
architectures. That list is first checked, using
gdbarch_list_lookup_by_info to see if there is
already an architecture defined suitable for the given
struct gdbarch_info and if so it is returned.
Otherwise a new struct gdbarch is created. For that the target
dependencies are saved in an OpenRISC 1000 specific
struct gdbarch_tdep, defined in
or1k-tdep.h.
struct gdbarch_tdep
{
  unsigned int  num_matchpoints;
  unsigned int  num_gpr_regs;
  int           bytes_per_word;
  int           bytes_per_address;
};
This is information beyond that which is held in the struct gdbarch. By using this structure, the GDB implementation for OpenRISC 1000 can be made flexible enough to deal with both 32 and 64-bit implementations and with variable numbers of registers and matchpoints.
| Caution |
|---|---|
Although this flexibility is built in to the code, the current implementation has only been tested with 32-bit OpenRISC 32 registers. |
The new architecture is then created by
gdbarch_alloc, passing in the struct gdbarch_info
and the struct gdbarch_tdep. The
struct gdbarch is populated using the various
set_gdbarch_ functions, and OpenRISC 1000 Frame
sniffers are associated with the architecture.
When creating a new struct gdbarch a function must be provided to dump
the target specific definitions in struct gdbarch_tdep to a file. This is
provided in or1k_dump_tdep. It is passed a
pointer to the struct gdbarch and a file handle and simply writes out the
fields in the struct gdbarch_tdep with suitable explanatory text.
The first entries in struct gdbarch initialize the size and format of all the standard data types.
set_gdbarch_short_bit             (gdbarch, 16);
set_gdbarch_int_bit               (gdbarch, 32);
set_gdbarch_long_bit              (gdbarch, 32);
set_gdbarch_long_long_bit         (gdbarch, 64);
set_gdbarch_float_bit             (gdbarch, 32);
set_gdbarch_float_format          (gdbarch, floatformats_ieee_single);
set_gdbarch_double_bit            (gdbarch, 64);
set_gdbarch_double_format         (gdbarch, floatformats_ieee_double);
set_gdbarch_long_double_bit       (gdbarch, 64);
set_gdbarch_long_double_format    (gdbarch, floatformats_ieee_double);
set_gdbarch_ptr_bit               (gdbarch, binfo->bits_per_address);
set_gdbarch_addr_bit              (gdbarch, binfo->bits_per_address);
set_gdbarch_char_signed           (gdbarch, 1);
These struct gdbarch functions provide information about the architecture.
set_gdbarch_return_value          (gdbarch, or1k_return_value);
set_gdbarch_breakpoint_from_pc    (gdbarch, or1k_breakpoint_from_pc);
set_gdbarch_single_step_through_delay
                                  (gdbarch, or1k_single_step_through_delay);
set_gdbarch_have_nonsteppable_watchpoint
                                  (gdbarch, 1);
switch (gdbarch_byte_order (gdbarch))
  {
  case BFD_ENDIAN_BIG:
    set_gdbarch_print_insn        (gdbarch, print_insn_big_or32);
    break;

  case BFD_ENDIAN_LITTLE:
    set_gdbarch_print_insn        (gdbarch, print_insn_little_or32);
    break;

  case BFD_ENDIAN_UNKNOWN:
    error ("or1k_gdbarch_init: Unknown endianism");
    break;
    }
or1k_return_value. This function tells
GDB how a value of a particular type would be returned by the
ABI. Structures/unions and large scalars (> 4 bytes) are
placed in memory and returned by reference
(RETURN_VALUE_ABI_RETURNS_ADDRESS. Smaller
scalars are returned in GPR 11
(RETURN_VALUE_REGISTER_CONVENTION).
or1k_breakpoint_from_pc returns the
breakpoint function to be used at a given program counter
address. Since all OpenRISC 1000 instructions are the same size,
this function always returns the same value, the instruction
sequence for a l.trap instruction.
or1k_single_step_through_delay. This
function is used to determine if a single stepped instruction is
actually executing a delay slot. This is the case if the
previously executed instruction was a branch or jump.
print_insn_big_or32 and
print_insn_little_or32. There are two
variants of the disassembler, depending on the endianism. The
disassembler is discussed in more detail in Section 4.4.
The register architecture is defined by two groups of struct gdbarch functions and fields. The first group specifies the number of registers (both raw and pseudo) and the register numbers of some "special" registers.
set_gdbarch_pseudo_register_read  (gdbarch, or1k_pseudo_register_read);
set_gdbarch_pseudo_register_write (gdbarch, or1k_pseudo_register_write);
set_gdbarch_num_regs              (gdbarch, OR1K_NUM_REGS);
set_gdbarch_num_pseudo_regs       (gdbarch, OR1K_NUM_PSEUDO_REGS);
set_gdbarch_sp_regnum             (gdbarch, OR1K_SP_REGNUM);
set_gdbarch_pc_regnum             (gdbarch, OR1K_PC_REGNUM);
set_gdbarch_ps_regnum             (gdbarch, OR1K_SR_REGNUM);
set_gdbarch_deprecated_fp_regnum  (gdbarch, OR1K_FP_REGNUM);
The second group of functions provides information about registers.
set_gdbarch_register_name         (gdbarch, or1k_register_name);
set_gdbarch_register_type         (gdbarch, or1k_register_type);
set_gdbarch_print_registers_info  (gdbarch, or1k_registers_info);
set_gdbarch_register_reggroup_p   (gdbarch, or1k_register_reggroup_p);
The representation of the raw registers (see
Section 2.3.5.3) is: registers 0-31 are the
corresponding GPRs, register 32 is the previous program counter,
33 is the next program counter (often just called
the program counter) and register 34 is the
supervision register. For convenience, constants are defined in the
header, or1k_tdep.h, for all the special
registers.
#define OR1K_SP_REGNUM         1
#define OR1K_FP_REGNUM         2
#define OR1K_FIRST_ARG_REGNUM  3
#define OR1K_LAST_ARG_REGNUM   8
#define OR1K_LR_REGNUM         9
#define OR1K_RV_REGNUM        11
#define OR1K_PC_REGNUM       (OR1K_MAX_GPR_REGS + 0)
#define OR1K_SR_REGNUM       (OR1K_MAX_GPR_REGS + 1)
In this implementation there are no pseudo-registers. A set could have been provided to represent the GPRs in floating point format (for use with the floating point instructions), but this has not been implemented. Constants are defined for the various totals
#define OR1K_MAX_GPR_REGS    32
#define OR1K_NUM_PSEUDO_REGS  0
#define OR1K_NUM_REGS        (OR1K_MAX_GPR_REGS + 3)
#define OR1K_TOTAL_NUM_REGS  (OR1K_NUM_REGS + OR1K_NUM_PSEUDO_REGS)
| Caution |
|---|---|
These totals are currently hard-coded constants. They should really draw on the data in the struct gdbarch_tdep, providing support for architectures which have less than the full complement of 32 registers. This functionality will be provided in a future implementation. |
One consequence of providing no pseudo-registers is that the frame pointer variable, $fp in GDB will not have its correct value. The provision of this register as an intrinsic part of GDB is no longer supported. If it is wanted then it should be defined as a register or pseudo-register.
However if there is no register with this name, GDB will use
either the value of the deprecated_fp_regnum
value in struct gdbarch or the current frame base, as reported by the
frame base sniffer.
For the time being, the deprecated_fp_regnum is
set. However the longer term plan will be to represent the
frame-pointer as a pseudo-register, taking the value of
GPR 2.
The register architecture is mostly a matter of setting the values
required in struct gdbarch. However two functions,
or1k_pseudo_register_read and
or1k_pseudo_register_write are defined to
provide access to any pseudo-register. These functions are defined
to provide hooks for the future, but in the absence of any
pseudo-registers they do nothing.
There are set of functions which yield information about the name and type of registers and which provide the output for the GDB info registers command.
or1k_register_name. This is a simple
table lookup to yield the register name from its number.
or1k_register_type. This function must
return the type as a
struct type. This GDB data
structure contains detailed information about each type and
its relationship to other types.
For the purposes of this function, a number of standard types
are predefined, with utility functions to construct other
types from them. For most registers the predefined
builtin_type_int32 is suitable. The stack
pointer and frame pointer are pointers to arbitrary data, so
the equivalent of void * is required. This is
constructed by applying the function
lookup_pointer_type to the predefined
builtin_type_void. The program counter is
a pointer to code, so the equivalent of a pointer to a void
function is appropriate. This is constructed by applying
lookup_pointer_type and
lookup_function_type to
builtin_type.
or1k_register_info. This function is used
by the info registers command to
display information about one or more registers.
This function is not really needed. It is just a wrapper for
default_print_registers_info, which is
the default setting for this function anyway.
or1k_register_reggroup_p. This predicate
function returns 1 (true) if a given register is in a
particular group. This is used by the command
info registers when registers in a
particular category are requested.
The function as implemented is little different from the
default function
(default_register_reggroup_p), which is
called for any unknown cases anyway. However it does make use
of the target dependent data (struct gdbarch_tdep), thus providing
flexibility for different OpenRISC 1000 architectures.
The OpenRISC 1000 frame structure is described in its ABI [8]. Some of the detail is slightly different in current OpenRISC implementations—this is described in Section 3.3.
The key to frame handling is understanding the prologue (and possibly epilogue) in each function which is responsible for initializing the stack frame. For the OpenRISC 1000, GPR 1 is used as the stack pointer, GPR 2 as the frame pointer and GPR 9 as the return address. The prologue sequence is:
l.addi r1,r1,-frame_size
l.sw save_loc(r1),r2
l.addi r2,r1,frame_size
l.sw save_loc-4(r1),r9
l.sw x(r1),ry
The OpenRISC 1000 stack frame accommodates any local (automatic) variables and temporary values, then the return address, then the old frame pointer and finally any stack based arguments to functions called by this function. This last rule means that the return address and old frame pointer are not necessarily at the end of the stack frame - enough space will be left to build up any arguments for called functions that must go on the stack. Figure 4.1 shows how the stack looks at the end of the prologue.
Not all fields are always present. The function need not save its return address to stack, and there may be no callee-saved registers (i.e. GPRs 12, 14, 16, 18, 20, 22, 24, 26, 28 and 30) which require saving. Leaf functions are not required to set up a new stack frame at all.
The epilogue is the inverse. Callee-saved registers are restored, the return address placed in GPR 9 and the stack and frame pointers restored before jumping to the address in GPR 9.
l.lwz ry,x(r1)
l.lwz r9,save_loc-4(r1)
l.lwz r2,save_loc(r1)
l.jr r9
l.addi r1,r1,frame_size
Only those parts of the epilogue which correspond to the prologue
need actually appear. The OpenRISC 1000 has a delay slot after
branch instructions, so for efficiency the stack restoration can be
placed after the l.jr instruction.
A group of struct gdbarch functions and a value provide information about the current stack and how it is being processed by the target program.
set_gdbarch_skip_prologue         (gdbarch, or1k_skip_prologue);
set_gdbarch_inner_than            (gdbarch, core_addr_lessthan);
set_gdbarch_frame_align           (gdbarch, or1k_frame_align);
set_gdbarch_frame_red_zone_size   (gdbarch, OR1K_FRAME_RED_ZONE_SIZE);
or1k_skip_prologue. This function returns
the end of the function prologue, if the program counter is
currently in a function prologue.
The initial approach is to use the DWARF2 symbol-and-line
(SAL) information to identify the start of the function
(find_pc_partial_function and hence the
end of the prologue
(skip_prologue_using_sal).
If this information is not available,
or1k_skip_prologue reuses the helper
functions from the frame sniffer function,
or1k_frame_unwind_cache (see Section 4.2.5.5) to step through code that
appears to be function prologue.
core_addr_lessthan. This standard function
returns 1 (true) if its first argument is a lower address than
its second argument. It provides the functionality required by
the struct gdbarch inner_than function for
architectures like OpenRISC 1000, which have falling stack
frames.
or1k_frame_align. This function takes a
stack pointer and returns a value (expanding the frame) which
meets the stack alignment requirements of the ABI. Since the
OpenRISC 1000 ABI uses a falling stack, this uses the
built-in function, align_down. The
alignment is specified in the constant
OR1K_STACK_ALIGN defined in
or1k-tdep.h.
OR1K_FRAME_RED_ZONE_SIZE. The OpenRISC 1000
reserves the 2,560 bytes below the stack pointer for use by
exception handlers and frameless functions. This is known as a
red zone (an AMD term). This constant is
recorded in the struct gdbarch frame_red_zone_size
field. Any dummy stack frames (see Section 4.2.5.3) will be placed after this point.
set_gdbarch_unwind_pc             (gdbarch, or1k_unwind_pc);
set_gdbarch_unwind_sp             (gdbarch, or1k_unwind_sp);
There are only two functions required here,
or1k_unwind_pc and
or1k_unwind_sp. Given a pointer to the NEXT
frame, these functions return the value of respectively the program
counter and stack pointer in THIS frame.
Since the OpenRISC architecture defines standard frame sniffers,
and both these registers are raw registers, the functions can be
implemented very simply by a call to
frame_unwind_register_unsigned.
Two struct gdbarch provide support for calling code in the target inferior.
set_gdbarch_push_dummy_call       (gdbarch, or1k_push_dummy_call);
set_gdbarch_unwind_dummy_id       (gdbarch, or1k_unwind_dummy_id);
or1k_push_dummy_call. This function
creates a dummy stack frame, so that GDB can evaluate a
function within the target code (for example in a
call command). The input arguments include
all the parameters for the call, including the return address
and an address where a structure should be returned.
The return address for the function is always breakpointed (so
GDB can trap the return). This return address is written
into the link register (in the register cache) using
regcache_cooked_write_unsigned).
If the function is to return a structure, the address where the structure is to go is passed as a first argument, in GPR 3.
The next arguments are passed in the remaining argument registers (up to GPR 8). Structures are passed by reference to their locating in memory. For 32-bit architectures passing 64-bit arguments, a pair of registers (3 and 4, 5 and 6 or 7 and 8) are used.
Any remaining arguments must be pushed on the end of the stack. There is a difficulty here, since pushing each argument may leave the stack misaligned (OpenRISC 1000 specifies double-word alignment). So the code first works out the space required, then adjusts the resulting stack pointer to the correct alignment. The arguments can then be written to the stack in the correct location.
or1k_unwind_dummy_id. This is the inverse
of or1k_push_dummy_call. Given a pointer
to the NEXT stack frame (which will be the frame of the
dummy call), it returns the frame ID (that is the stack
pointer and function entry point address) of THIS frame.
This is not completely trivial. For a dummy frame, the NEXT
frame information about THIS frame is not necessarily
complete, so a simple call to
frame_unwind_id recurses back to this
function ad infinitum. Instead the frame
information is built by unwind the stack pointer and program
counter and attempting to use DWARF2 symbol-and-line (SAL)
information to find the start of the function from the PC
with find_pc_partial_function. If that
information is not available, the program counter is used as a
proxy for the function start address.
The preceding functions all have a 1:1 relationship with struct gdbarch. However for stack analysis (or "sniffing") more than one approach may be appropriate, so a list of functions is maintained.
The low level stack analysis functions are set by
frame_unwind_append_sniffer. The OpenRISC 1000
has its own sniffers for finding the ID of a frame and getting the
value of a register on the frame specified by
or1k_frame_sniffer. For all other sniffing
functions, the default DWARF2 frame sniffer is used,
dwarf2_frame_sniffer.
The high level sniffer finds the base of the stack frame. OpenRISC
defines its own base sniffer,
or1k_frame_base as default. It provides all
the functionality needed, so can be used as the default base
sniffer, set using frame_base_set_default. The
frame base is a structure, with entries pointing to the
corresponding frame sniffer and functions to give the base address
of the frame, the arguments on the frame and the local variables on
the frame. Since these are all the same for the OpenRISC 1000, the
same function, or1k_frame_base_address is used
for all three.
The same function, or1k_frame_base_address is
used to provide all three base functions: for the frame itself,
the local variables and any arguments. In the OpenRISC 1000 these
are all the same value.
or1k_frame_base.unwind      = or1k_frame_sniffer (NULL);
or1k_frame_base.this_base   = or1k_frame_base_address;
or1k_frame_base.this_locals = or1k_frame_base_address;
or1k_frame_base.this_args   = or1k_frame_base_address;
frame_base_set_default            (gdbarch, &or1k_frame_base);
The specification of this function requires the end of
the stack, i.e. the stack pointer. Rather confusingly the function
is also used to
determine the value of the $fp variable if
deprecated_fp_regnum has not been set and there
is no register with the name "fp". However, as noted earlier, GDB
is moving away from an intrinsic understanding of frame
pointers. For the OpenRISC 1000,
deprecated_fp_regnum is currently defined,
although in time a pseudo register will be defined, with the name
of fp and mapping to GPR 2.
Like all the frame sniffers, this function is
passed the address of the NEXT frame, and requires the value for
THIS frame, so the value of the stack pointer is unwound from
the stack by using the generic register unwinder,
frame_unwind_register_unsigned.
The function or1k_frame_sniffer returns a
pointer to struct frame_unwind with
entries for the functions defined by this sniffer. For the
OpenRISC 1000, this defines a custom function to construct the
frame ID of THIS frame given a pointer to the NEXT frame
(or1k_frame_this_id) and a custom function to
give the value of a register in THIS frame given a pointer to
the NEXT frame (or1k_frame_prev_register).
or1k_frame_this_id. This function's
inputs are a pointer to the NEXT frame and the prologue
cache (if any exists) for THIS frame. It uses the main
OpenRISC 1000 frame analyzer,
or1k_frame_unwind_cache to generate the
prologue cache if it does not exist (see below).
From the cached data, the function returns the frame ID. This comprises two values, the stack pointer for this frame and the address of the code (typically the entry point) for the function using this stack frame
| Note |
|---|---|
Strictly speaking frame IDs can have a third value, the special address for use with architectures which have more complex frame structures. However this is rarely used. |
The result is returned in a
struct frame_id passed by
reference as a third argument. Since the implementation uses
the built in
struct trad_frame_cache for its
register cache, the code can use the
trad_frame_get_id function to decode the
frame ID from the cache.
or1k_frame_prev_register. This function's
inputs are a pointer to the NEXT frame, the prologue cache
(if any exists) for THIS frame and a register number. It
uses the main OpenRISC 1000 frame analyzer,
or1k_frame_unwind_cache to generate the
prologue cache if it does not exist (see below).
From the cached data, a flag is returned indicating if the register has been optimized out (this is never the case), what sort of l-value the register represents (a register, memory or not an l-value), the address where it is saved in memory (if it is saved in memory), the number of a different register which holds the value of this register (if that is the case) and if a buffer is provided the actual value as obtained from memory or the register cache.
Since the implementation uses the built in
struct trad_frame_cache for its
register cache, the code can use the
trad_frame_get_register function to
decode all this information from the cache.
The OpenRISC 1000 low level sniffers rely on
or1k_frame_unwind_cache. This is the heart of
the sniffer. It must determine the frame ID for THIS frame given
a pointer to the NEXT frame and then the information in THIS
frame about the values of registers in the PREVIOUS frame.
All this data is returned in a prologue cache (see Section 2.3.6), a reference to which is passed as an argument. If the cache already exists for THIS frame it can be returned immediately as the result.
If the cache does not yet exist, it is allocated (using
trad_frame_cache_zalloc). The first step
is to unwind the start address of this function from the
NEXT frame. The DWARF2 information in the object file can be
used to find the end of the prologue (using
skip_prologue_using_sal).
The code then works through each instruction of the prologue to find the data required.
| Caution |
|---|---|
The analysis must only consider prologue instructions that have actually been executed. It is quite possible the program counter is in the prologue code, and only instructions that have actually been executed should be analyzed. |
The stack pointer and program counter are found by simply
unwinding the NEXT frame. The stack pointer is the base of
THIS frame, and is added to the cache data using
trad_frame_set_this_base.
end_iaddr marks the end of the code we
should analyze. Only instructions with addresses less than
this will be considered.
The l.addi instruction should be first and
its immediate constant field is the size of the stack. If it
is missing, then this is a frameless call to a function. If
the program counter is right at the start of the function,
before the stack and frame pointers are set up, then it will
also look like a frameless function.
Unless it is subsequently found to have been saved on the stack, the program counter of the PREVIOUS frame is the link register of THIS frame and can be recorded in the register cache.
For a frameless call, there is no more information to be found, so the rest of the code analysis only applies if the frame size was non-zero.
The second instruction in the prologue is where the frame
pointer of the PREVIOUS frame is saved. It is an error if this
is missing. The address where it is saved (the stack pointer
of THIS frame plus the offset in the l.sw
instruction) is saved in the cache using
trad_frame_set_reg_addr.
The third instruction should be an l.addi
instruction which sets the frame pointer. The frame size set in
this instruction should match the frame size set in the first
instruction. Once this has been set up, the frame pointer can be
used to yield the stack pointer of the previous frame. This
information is recorded in the register cache.
The fourth instruction is optional and saves the return
address to the stack. If this instruction is found, the entry
in the register cache for the program counter in the PREVIOUS
frame must be changed using
trad_frame_set_reg_addr to indicate it is
found at an address in this frame.
All the subsequent instructions in the prolong should be saves
of callee-savable registers. These are checked for until the
code address has reached the end of the prologue. For each
instruction that is found, the save location of the register
is recorded in the cache using
trad_frame_set_reg_addr.
The detailed analysis in
or1k_frame_unwind_cache uses a series of
helper functions: or1k_frame_size,
or1k_frame_fp_loc,
or1k_frame_size_check,
or1k_link_address and
or1k_get_saved_reg. These helper routines
check each of the instructions in the prologue. By breaking out
this code into separate functions, they can be reused by
or1k_skip_prologue.
The code for the remote target specification for the OpenRISC Remote
JTAG protocol is found in the gdb
sub-directory. remote-or1k.c contains the target
definition. The low-level interface is found in
or1k-jtag.c with a shared header in
or1k-jtagh.
The low-level interface is abstracted to a set of OpenRISC 1000
specific functions relating to the behavior of the target. Two
implementations are provided (in or1k-jtag.c),
one for targets connected directly through the host's parallel port,
and one for targets connected over TCP/IP using the OpenRISC 1000
Remote JTAG Protocol.
void      or1k_jtag_init (char *args);
void      or1k_jtag_close ();
ULONGEST  or1k_jtag_read_spr (unsigned int  sprnum);
void      or1k_jtag_write_spr (unsigned int  sprnum,
                               ULONGEST      data);
int       or1k_jtag_read_mem (CORE_ADDR  addr,
                              gdb_byte  *bdata,
                              int        len);
int       or1k_jtag_write_mem (CORE_ADDR       addr,
                               const gdb_byte *bdata,
                               int             len);
void      or1k_jtag_stall ();
void      or1k_jtag_unstall ();
void      or1k_jtag_wait (int  fast);
The choice of which implementation to use is determined by the
argument to or1k_jtag_init.
or1k_jtag_init and
or1k_jtag_close. Initialize and close a
connection to the target. or1k_jtag_init is
passed an argument string with the address of the target (either a
local device or a remote TCP/IP port address). An optional second
argument, reset can be provided to indicate the
target should be reset once connected.
or1k_jtag_read_spr and
or1k_jtag_write_spr. Read or write a special
purpose register.
or1k_jtag_read_mem and
or1k_jtag_write_mem. Read or write a block of
memory.
or1k_jtag_stall and
or1k_jtag_unstall. Stall or unstall the target.
or1k_jtag_wait. Wait for the target to stall.
The binaries for the remote target interface
(remote-or1k.o and
or1k-jtag.o) are added to the
configure.tgt file for the OpenRISC targets. As
noted in Section 4.2, this only specifies
binaries, so dependencies on headers cannot be captured. To do this
requires editing the Makefile.in.
![[Tip]](./images/tip.png) | Tip |
|---|---|
As a shortcut for a simple port, editing
|
The remote target is created by defining the function
_initialize_remote_or1k. A new struct target_ops,
or1k_jtag_target is populated and added as a
target by calling add_target.
The majority of the target operations are generic to OpenRISC 1000, and independent of the actual low level interface. This is achieved by abstracting the low level interface through the interface functions described in Section 4.3.
Having established all the target functions, the target is added by
calling add_target
When a target is selected (with the GDB
target jtag command), the set of target
operations chosen for use with the OpenRISC 1000 architecture will
be referred to by the global variable,
or1k_target, defined in
or1k-tdep.c.
Much of the operation of the target interface involves manipulating
the debug SPRs. Rather than continually writing them out to the
target, a cache of their values is maintained in
or1k_dbgcache, which is flushed prior to any
operation that will unstall the target (thus causing it to execute).
A group of variables and functions give the name of the interface and different types of information.
to_shortname. This is the name of the target
for use when connecting in GDB. For the OpenRISC 1000, it is
"jtag", so connection in GDB will be
established by using the command
target jtag ....
to_longname. A brief description of the
command for use by the GDB info target
command.
to_doc. The help text for this target. The
first sentence is used for general help about all targets, the
full text for help specifically about this target. The text
explains how to connect both directly and over TCP/IP.
or1k_files_info. This function provides the
initial information for info target. For
the OpenRISC 1000 it provides the name of the program being run
on the target, if known.
OpenRISC remote targets are always executable, with full access to memory, stack, registers etc once the connection is established. A set of variables in struct target_ops for OpenRISC 1000 records this.
to_stratum. Since the OpenRISC 1000 target
can execute code, this field is set to
process_stratum.
to_has_all_memory,
to_has_memory,
to_has_stack and
to_has_registers. Once the OpenRISC 1000
target is connected, it has access to all its memory, a stack
and registers, so all these fields are set to 1 (true).
to_has_execution. When the connection is
initially established, the OpenRISC 1000 processor will be
stalled, so is not actually executing. So this field is
initialized to 0 (false).
to_have_steppable_watchpoint and
to_have_continuable_watchpoint. These flags
indicate whether the target can step through a watchpoint
immediately after it has been executed, or if the watchpoint can
be immediate continued without having any effect.
If the OpenRISC 1000 triggers a hardware watchpoint, the instruction affected will not have completed execution, so must be re-executed (the code cannot continue). Furthermore the watchpoint must be temporarily disabled while re-executing, or it will trigger again (it is not steppable). Thus both these flags are set to 0 (false).
These functions control the connection to the target. For remote targets this involves setting up and closing down a TCP/IP socket link to the server driving the hardware. For local targets it involves opening and closing the device.
or1k_open. This is passed the arguments
to the target jtag command and establishes
the connection to the target. The arguments are the address of
the target (either a local device, or a TCP/IP host/port
specification) and an optional second argument
reset indicating the target should be reset
on connection.
Any existing connections are tidied up by
target_preopen and any instances of this
target are removed from the target stack by
unpush_target.
Connection is then established through the low level interface
routine, or1k_jtag_init, which resets the
target if requested.
With the connection established, the target's Unit Present SPR is checked to verify it has a debug unit available. Data about the number of GPRs and matchpoints is read from the CPU Configuration SPR and used to update struct gdbarch_tdep.
The target processor is then stalled, to prevent further execution, with a 1000μs wait to allow the stall to complete.
The debug cache is cleared, and the Debug Stop SPR set to trigger the JTAG interface on trap exceptions (which are used for debug breakpoints, watchpoints and single stepping). The cache will be written out to the SPRs before execution recommences.
Having established a connection, the target is pushed on to
the stack. It is marked running, which sets all the flags
associated with a running process and updates the choice of
current target (which depending on the stratum could be this
target). However, the OpenRISC connection is established with
the target processor stalled, so the
to_has_execution flag is cleared by setting
the macro target_has_execution to 0. It
will be set when or1k_resume unstalls the
target.
As a matter of good housekeeping, any shared library symbols
are cleared using no_shared_libraries.
GDB identifies all inferior executables by their process and
thread ID. This port of the OpenRISC 1000 is for bare metal debugging,
so there is no concept of different processes that may be
executing. Consequently the null_ptid is used
as the process/thread ID for the target. This is set in the
GDB global variable inferior_pid.
| Note |
|---|---|
It is important that the inferior process/thread ID is established at this early stage, so that the target can always be uniquely identified. |
Finally the generic start_remote is called
to set up the new target ready for execution. It is possible
this could fail, so the call is wrapped in a function,
or1k_start_remote, which has the correct
prototype to run using catch_exception. If
failure occurs, the target can be popped, before the exception
is thrown on to the top level.
or1k_close. This closes the connection by
calling the low level interface function,
or1k_jtag_close. The target will
already have been unpushed and the inferior mourned (see Section 4.3.6), so these
actions are not required.
or1k_detach. This just detaches from the
target being debugged, which is achieved by calling
or1k_close.
There is no explicit function to reattach to the target, but a
call to or1k_open (by giving a
target jtag command in GDB) will
achieve the same effect.
These are a group of functions to access the registers and memory of the target.
or1k_fetch_registers. This function
populates the register cache from the actual target
registers. The interface to the OpenRISC 1000 only provides
for reading of memory or SPRs. However the GPRs are
mapped into the SPR space, so can be read in this way.
or1k_store_registers. This is the inverse
of or1k_fetch_registers. It writes the
contents of the register cache back to the physical registers
on the target.
or1k_prepare_to_store. GDB allows for
targets which need some preparatory work before storing, so
provides this function. It is not needed for the OpenRISC 1000, so just
returns.
or1k_xfer_partial. This is the
generic function for reading and writing objects from and to
the target. However the only class of object which needs be
supported is read and write from memory. This is achieved
through the low-level interface routines
or1k_jtag_read_mem and
or1k_jtag_write_mem.
generic_load. This generic function is used
as the to_load function of the target
operations. There is nothing special about loading OpenRISC 1000
images. This function will call the
or1k_xfer_partial function to transfer the
bytes for each section of the image.
The OpenRISC 1000 can support hardware breakpoints and watchpoints, if matchpoints are free in the debug unit.
or1k_set_breakpoint. This is the underlying
OpenRISC 1000 function which sets a hardware breakpoint if one
is available. This is controlled through the Debug Value
Register and Debug Control Register. This function is used by
the target operation functions
or1k_insert_breakpoint and
or1k_insert_hw_breakpoint.
The first free hardware matchpoint is found by searching
through the Debug Control Registers for a register without its
DVR/DCR Preset (DP) flag set using
or1k_first_free_matchpoint.
The Debug Value Register is set to the address of the breakpoint and the Debug Control Register to trigger when the unsigned effective address of the fetched instruction is equal to the Debug Value Register. The corresponding OpenRISC 1000 watchpoint is marked as unchained in Debug Mode Register 1 and set to trigger a trap exception in Debug Mode Register 2.
or1k_clear_breakpoint. This is the
counterpart to or1k_set_breakpoint. It is
called by the target operation functions
remove_breakpoint and
remove_hw_breakpoint.
The Debug Control Registers are searched for an entry matching
the given address (using
or1k_matchpoint_equal). If a register is
found, its DVR/DCR Present flag is cleared, and the
matchpoint marked unused in Debug Mode Register 2.
or1k_insert_breakpoint. This function
inserts a breakpoint. It tries to insert a hardware breakpoint
using or1k_set_breakpoint. If this fails,
the generic memory_insert_breakpoint is
used to set a software breakpoint.
or1k_remove_breakpoint. This is the
counterpart to or1k_insert_breakpoint. It
tries to clear a hardware breakpoint, and if that fails tries
to clear a software breakpoint using the generic
memory_remove_breakpoint.
or1k_insert_hw_breakpoint and
or1k_remove_hw_breakpoint. These
functions are similar to
or1k_insert_breakpoint and
or1k_remove_breakpoint. However if a
hardware breakpoint is not available, they do not attempt to
use a software (memory) breakpoint instead.
or1k_insert_watchpoint. This function
attempts to insert a GDB hardware watchpoint. For this it
requires a pair of OpenRISC 1000 watchpoints chained
together. The first will check for a memory access greater than
or equal to the start address of interest. The second will check
for a memory access less than or equal to the end address of
interest. If both criteria are met. The access type can be the
load effective address (for GDB rwatch
watchpoints), store effective address (for GDB
watch watchpoints) or both (for GDB
awatch watchpoints).
The pair of OpenRISC 1000 watchpoints must be adjacent (so they
can be chained together using Debug Mode Register 1), but it is
possible that successive breakpoints have fragmented the use of
OpenRISC 1000
watchpoints. or1k_watchpoint_gc is used to
shuffle up all the existing OpenRISC 1000 watchpoints which can
be moved, to find a pair if possible.
or1k_remove_watchpoint. This is the
counterpart of or1k_insert_watchpoint. It
searches for an adjacent pair of OpenRISC 1000 watchpoints that
match using or1k_matchpoint_equal. If found
both are marked unused in their Debug Control Register and
cleared from triggering in Debug Mode Register 2.
or1k_stopped_by_watchpoint and
or1k_stopped_data_address. These functions
are called to find out about GDB watchpoints which may have
triggered. Both make use of the utility function,
or1k_stopped_watchpoint_info, which
determines if a GDB watchpoint was triggered, if so which
watchpoint and for what
address. or1k_stopped_watchpoint just
returns a Boolean to indicate if a watchpoint was
triggered. or1k_stopped_data_address is
called once for each watchpoint that has triggered. It returns
the address that triggered the watchpoint and must also clear
the watchpoint (in Debug Mode Register 2).
When the run command is used to start execution
with GDB it needs to establish the executable on the inferior, and
then start execution. This is done using the
to_create_inferior and
to_resume functions of the target respectively.
Once execution has started, GDB waits until the target
to_wait function returns control.
In addition the target provides operations to stop execution.
or1k_resume. This is the function which
causes the target program to run. It is called in response to
the run, step,
stepi, next and
nexti instructions.
The behavior of this function is far simpler than its
counterpart in GDB 5.3, which required complex logic to
re-execute instructions after a breakpoint or
watchpoint. GDB 6.8 will sort out all the issues of
re-execution after a breakpoint or watchpoint has been
encountered (see or1k_wait below for more
on this).
The function clears the Debug Reason Register, clears any watchpoint status bits in Debug Mode Register 2 and then commits the debug registers.
If the caller has requested single stepping, this is set using Debug Mode Register 1, otherwise this is cleared.
Finally the target can be marked as executing (the first time
or1k_resume is called it will not be marked
as executing), the debug registers written out, and the processor
unstalled.
or1k_wait . This function waits for the
target to stall, and analyzes the cause. Information about why
the target stalled is returned to the caller via the
status argument. The function returns the
process/thread ID of the process which stalled, although for
the OpenRISC 1000 this will always be the same value.
While waiting for the target to stall (using
or1k_jtag_wait), a signal handler is
installed, so the user can interrupt execution with ctrl-C.
After the wait returns, all register and frame caches are
invalid, These are cleared by calling
registers_changed (which in turn clears
the frame caches).
When the processor stalls, the Debug Reason Register (a SPR)
shows the reason for the stall. This will be due to any
exception set in the Debug Stop Register (currently only trap),
due to a single step, due to a reset (the debugger stalls the
processor on reset) or (when the target is the architectural
simulator, Or1ksim) due to an exit
l.nop 1 being executed.
In all cases the previous program counter SPR points to the instruction just executed and the next program counter SPR to the instruction about to be executed. For watchpoints and breakpoints, which generate a trap however the instruction at the previous program counter will not have completed execution. As a result, when the program resumes, this instruction should be re-executed without the breakpoint/watchpoint enabled.
GDB understands this. It is sufficient to set the program
counter to the previous program counter. GDB will realize
that the instruction corresponds to a breakpoint/watchpoint
that has just been encountered, lift the breakpoint, single
step past the instruction and reimpose the breakpoint. This is
achieved by a call to write_pc with the
previous program counter value.
The OpenRISC 1000 imposes a slight problem here. The standard GDB approach works fine, except if the breakpoint was in the delay slot of a branch or jump instruction. In this case the re-execution must be not just of the previous instruction, but the one before that (restoring the link register as well if it was a jump-and-link instruction). Furthermore this must only be in the case where the branch was truly the preceding instruction, rather than the delay slot having been the target of a different branch instruction.
In the absence of a "previous previous" program counter, this restart cannot be correct under all circumstances. For the time being, breakpoints on delay slots are not expected to work. However it is highly unlikely a source level debugger would ever place a breakpoint in a delay slot.
A more complete solution for the future would use the struct gdbarch
adjust_breakpoint_address to move any
breakpoint requested for a delay slot, to insist the breakpoint
is placed on the preceding jump or branch. This would work for
all but the most unusual code, which used a delay slot as a
branch target.
Having sorted out the program counter readjustment, any single
step is marked as though it were a trap. Single step does not
set the trap exception, nor does it need re-executing, but by
setting the flag here, the exception will be correctly mapped
to the TARGET_SIGNAL_TRAP for return to
GDB
The response is marked as a a stopped processor
(TARGET_WAITKIND_STOPPED). All
exceptions are mapped to their corresponding GDB signals. If
no exception has been raised, then the signal is set to the
default, unless the instruction just executed was
l.nop 1, which is used by the
architectural simulator to indicate termination. In this case
the response is marked as
TARGET_WAITKIND_EXITED, and the associate
value set to the exit return code.
The debug reason register (which is sticky) can now be cleared and the process/thread ID returned.
or1k_stop. This stops the processor
executing. To achieve this cleanly, the processor is stalled,
single step mode is set and the processor unstalled, so
execution will have stopped at the end of an instruction.
or1k_kill. This is a more dramatic
termination, when or1k_stop has failed to
give satisfaction. Communication with the target is assumed to
have broken down, so the target is then mourned, which will
close the connection.
or1k_create_inferior. This sets up a
program to run on the target, but does not actually start it
running. It is called in response to the GDB
run command and is passed any arguments to
that command. However the OpenRISC 1000 JTAG protocol has no
way to send arguments to the target, so these are ignored.
Debugging is much easier if a local copy of the executable symbol table has been loaded with the file command. This is checked for and a warning issued. However if it is not present, it is perfectly acceptable to debug code on the OpenRISC 1000 target without symbol data.
All static data structures (breakpoint lists etc) are then
cleared within GDB by calling
init_wait_for_inferior.
or1k_mourn_inferior. This is the
counterpart to or1k_create_inferior,
called after execution has completed. It tidies up by calling
the generic function
generic_mourn_inferior. If the target is
still shown as having execution, it is marked as exited, which
will cause the selection of a new current target.
The OpenRISC 1000 target does not really have a way to execute commands. However implementing SPR access as remote commands provides a mechanism for access, which is independent of the target access protocol. In particular the GDB architecture need know nothing about the actual remote protocol used.
SPR access is implemented as though the target were able to run two commands, readspr to get a value from a SPR and writespr to set a value in a SPR. Each takes a first argument, specified in hexadecimal, which is the SPR number. writespr takes a second argument, specified in hexadecimal, which is the value to be written. readspr returns the value read as a number in hexadecimal.
When access is needed to the SPRs it is achieved by passing one of
these commands as argument to the to_rcmd
function of the target.
or1k_rcmd. The command to execute
(readspr or writespr) is
passed as the first argument. Results of the command are written
back throug the second argument, which is a UI independent file
handle.
readspr is mapped to the corresponding call
to or1k_jtag_read_spr.
writespr is mapped to the corresponding call
to or1k_jtag_write_spr. In the case of an
error (for example badly formed command), the result
"E01" is returned. If
writespr is successful,
"OK" is returned as result. If
readspr is successful, the value as
hexadecimal is returned as result. In all cases the result is
written as a string to the UI independent file handle specified
as second argument to the function.
The interface to the OpenRISC JTAG system is found in
gdb/or1k-jtag.c and
gdb/or1k-jtag.h. The details are not directly
relevant to porting GDB so only an overview is given here. Full
details are found in the commenting within the source code.
The interface is layered, to maximize use. In particular much of the functionality is the same whether the target is connected remotely over TCP/IP or directly via a JP1 header connected to the parallel port.
The highest level is the public function interface, which
operate in terms of entities that are visible in GDB: open and
close the connection, read and write SPRs, read and write
memory, stall, unstall and wait for the processor. These
functions always succeed and have function prefixes
or1k_jtag_.
The next level is the abstraction provided by the OR1K JTAG
protocol: read/write a JTAG register, read/write a block of
JTAG registers and select a scan chain. These functions may
encounter errors and will deal with them, but otherwise return
no error result. These are static functions (i.e. local to this
file), with prefixes or1k_jtag_.
The next level is in two sets, one for use with a locally
connected (JP1) JTAG and one for a remote connection over
TCP/IP corresponding to the functions in the previous
layer. These functions detect with errors and return an error
code to indicate an error has occurred. These are static
functions with prefixes: jp1_ and
jtr_ respectively.
The final level comes in separate flavors for locally connected
JTAG (low level routines to drive the JP1 interface) and
remote use (to build and send/receive packets over
TCP/IP). These functions detect errors and return an error code
to indicate an error has occurred. These are static function
with prefixes jp1_ll_ and
jtr_ll_ respectively.
Errors are either dealt with silently or (if fatal) via the GDB
error function.
The OpenRISC 1000 disassembler is part of the wider
binutils utility set and is found in the
opcodes sub-directory. It provides two versions of
the disassembly function, print_insn_big_or32 and
print_insn_little_or32 for use with big-endian
and little-endian implementations of the architecture in
or32-dis.c
The instruction decode uses a finite state automaton (FSA) in
or32-opc.c. This is constructed at start-up by
the function build_automata from a table
describing the instruction set. This function is invoked from the
_initialize_or1k_tdep function immediately after
the OpenRISC 1000 architecture has been defined.
The disassembler takes advantage of any symbol table information to replace branch and jump targets by symbolic names where possible.
Section 2.5 describes how to extend the GDB command set. For the OpenRISC 1000 architecture, the info command is extended to show the value of SPRs (info spr) and a new command, spr is added to set the value of a SPR[2].
Both these commands are added in
_initialize_or1k_tdep after the architecture has
been created and the disassembler automata initialized.
The new sub-command for info is added using
add_info
add_info ("spr", or1k_info_spr_command,
          "Show the value of a special purpose register");
The functionality is provided in
or1k_info_spr_command. The user can specify a
group by name or number (the value of all registers in that group is
displayed), or a register name (the value of that register is
displayed) or a group name/number and register name/number (the
value of that register in the group is displayed).
The arguments are broken out from the text of the command using
or1k_parse_params, which also handles any
errors in syntax or semantics. If the arguments are successfully
parsed the results are then printed out using the UI independent
function, ui_out_field_fmt.
The SPR is read using the convenience function
or1k_read_spr. This converts the access to a
call of the command readspr, which can be passed
to the target usings its to_rcmd target
operation (see Section 4.3.7). This will
allow the SPR to be accessed in the way most appropriate to the
current target access method.
This new top level command is added, classified as a support command
(class_support), using the
add_com command.
The functionality is provided in
or1k_spr_command. This also uses
or1k_parse_spr_params to parse the arguments,
although there is now one more (the value to set). The new value is
written into the relevant SPR and the change recorded using
ui_out_field_fmt.
The SPR is written using the convenience function
or1k_write_spr. This converts the access to a
call of the command writespr, which can be passed
to the target usings its to_rcmd target
operation (see Section 4.3.7). This will
allow the SPR to be accessed in the way most appropriate to the
current target access method.
[2] There is a strong case for this being a new sub-command of the set. However the spr command was introduced in GDB 5.0, and there is no point in replacing it now.
This application note has described in detail the steps required to port GDB to a new architecture. That process has been illustrated using the port for the OpenRISC 1000 architecture.
Suggestions for corrections or improvements are welcomed. Please contact
the author at jeremy.bennett@embecosm.com.
The low-level interface between an application program and the operating system, thus ensuring binary compatibility between programs.
A description of the relationship between byte and word addressing on a computer architecture. In a big endian architecture, the least significant byte in a data word resides at the highest byte address (of the bytes in the word) in memory.
The alternative is little endian addressing.
See also little endian.
A package which allows applications to use the same routines to operate on object files whatever the object file format [5]. A new object file format can be supported simply by creating a new BFD back end and adding it to the library.
A specification of a format for executable, object code, and shared library computer files used on Unix systems. Now largely replaced by ELF
See also Executable and Linkable Format (ELF).
a common standard file format for executables, object code, shared libraries, and core dumps. It is the standard binary file format for Unix and Unix-like systems on x86, where it has largely replaced COFF.
Formerly known as the Extensible Linking Format.
See also Common Object File Format (COFF).
In stack based languages, the stack pointer typically refers to the end of the local frame. The frame pointer is a second register, which refers to the beginning of the local frame. Not all stack based architectures make use of a frame pointer.
See also Stack Frame.
In the OpenRISC 1000 architecture, one of between 16 and 32 general purpose integer registers.
Although these registers are general purpose, some have specific
roles defined by the architecture and the ABI. GPR 0 is
always 0 and should not be written to. GPR 1 is the stack
pointer, GPR 2 the frame pointer and GPR 9 the return
address set by l.jal (known as the link register)
and l.jalr instructions. GPR 3 through
GPR 8 are used to pass arguments to functions, with scalar
results returned in GPR 11.
See also Application Binary Interface.
JTAG is the usual name used for the IEEE 1149.1 standard entitled Standard Test Access Port and Boundary-Scan Architecture for test access ports used for testing printed circuit boards and chips using boundary scan.
This standard allows external reading of state within the board or chip. It is thus a natural mechanism for debuggers to connect to embedded systems.
A description of the relationship between byte and word addressing on a computer architecture. In a little endian architecture, the least significant byte in a data word resides at the lowest byte address (of the bytes in the word) in memory.
The alternative is big endian addressing.
See also big endian.
A hardware component which maps virtual address references to physical memory addresses via a page lookup table. An exception handler may be required to bring non-existent memory pages into physical memory from backing storage when accessed.
On a Harvard architecture (i.e. with separate logical instruction and data address spaces), two MMUs are typically needed.
An operating system for real-time embedded systems offering a POSIX interface. It offers no concept of processes or memory management.
In the OpenRISC 1000 architecture, one of up to 65536 registers controlling all aspects of the processor. The registers are arranged in groups of 2048 registers. The present architecture defines 12 groups in total.
In general each group controls one component of the processor. Thus there is a group to control the DMMU, the IMMU the data and instruction caches and the debug unit. Group 0 is the system group and includes all the system configuration registers, the next and previous program counters, supervision register and saved exception registers.
In procedural languages, a dynamic data structure used to hold the values of local variables in a procedure at a particular point of execution.
Typically successive stack frames are placed next to each other in a linear data area. The last address of the current stack frame is pointed to by a register, known as the stack pointer. It will be the first address of the next stack pointer.
See also frame pointer.
A silicon chip which includes one or more processor cores.
[1] Embecosm Application Note 2. The OpenCores OpenRISC 1000 Simulator and Tool Chain: Installation Guide. Issue 3. Embecosm Limited, November 2008.
[2] Embecosm Application Note 4. Howto: GDB Remote Serial Protocol: Writing a RSP Server. Embecosm Limited, November 2008.
[3] Debugging with GDB: The GNU Source-Level Debugger, Richard Stallman, Roland Pesch, Stan Shebbs, et al, issue 9. Free Software Foundation 2008 . http://sourceware.org/gdb/current/onlinedocs/gdb_toc.html
[4] GDB Internals: A guide to the internals of the GNU debugger, John Gillmore and Stan Shebbs, issue 2. Cygnus Solutions 2006 . http://sourceware.org/gdb/current/onlinedocs/gdbint_toc.html
[6] Debugging the OpenRISC 1000 with GDB: Target Processor Manual, Jeremy Bennett, issue 1. Embecosm Limited June 2008 . http://www.embecosm.com/packages/esp3/embecosm-esp3-or32-gdb-6.8-or1k-manual-html-2.0/or1k.html
[7] Doxygen: Source code documentation generator tool, Dimitri van Heesch, 2008 . http://www.doxygen.org
[8] OpenRISC 1000 Architectural Manual, Damjan Lampret, Chen-Min Chen, Marko Mlinar, Johan Rydberg, Matan Ziv-Av, Chris Ziomkowski, Greg McGary, Bob Gardner, Rohit Mathur and Maria Bolado, November 2005 . http://www.opencores.org/cvsget.cgi/or1k/docs/openrisc_arch.pdf
[9] Texinfo: The GNU Documentation Format Robert J Chassell and Richard Stallman, issue 4.12. Free Software Foundation 9 April, 2008 .
[10] OpenRISC 1000: ORPSoC Damjan Lampret et al. OpenCores http://opencores.org/projects.cgi/web/or1k/orpsoc
[11] SoC Debug Interface Igor Mohor, issue 3.0. OpenCores 14 April, 2004 . http://opencores.org/cvsweb.shtml/dbg_interface/doc/DbgSupp.pdf