| Services - tools - models - for embedded software development |
|---|
| Services - tools - models - for embedded software development |
|---|

 |  | |
GDB needs to understand the stack on which local (automatic) variables are stored. The area of the stack containing all the local variables for a function invocation is known as the stack frame for that function (or colloquially just as the "frame"). In turn the function that called the function will have its stack frame, and so on back through the chain of functions that have been called.
Almost all architectures have one register dedicated to point to the end of the stack (the stack pointer). Many have a second register which points to the start of the currently active stack frame (the frame pointer). The specific arrangements for an architecture are a key part of the ABI.
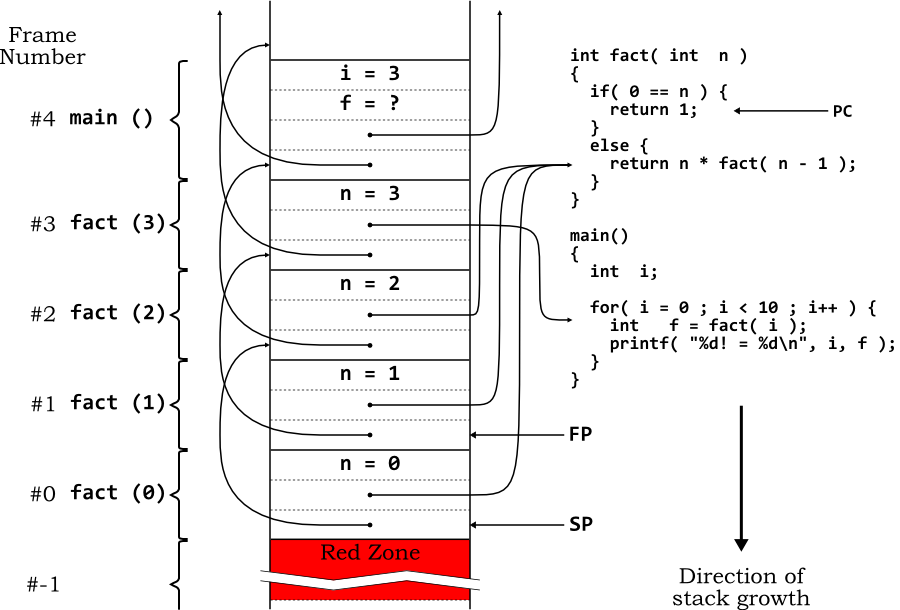
A diagram helps to explain this. Here is a simple program to compute factorials:
 1:   #include <stdio.h>
 2:
 3:   int fact( int  n )
 4:   {
 5:     if( 0 == n ) {
 6:       return 1;
 7:     }
 8:     else {
 9:       return n * fact( n - 1 );
10:     }
11:   }
12:
13:   main()
14:   {
15:     int  i;
16:
17:     for( i = 0 ; i < 10 ; i++ ) {
18:       int   f = fact( i );
19:       printf( "%d! = %d\n", i, f );
20:     }
21:   }
Consider the state of the stack when the code reaches line 6 after
the main program has called fact (3). The
chain of function calls will be main,
fact (3),
fact (2),
fact (1) and
fact (0). In this example the stack is
falling (as used by the OpenRISC 1000 ABI). The stack pointer
(SP) is at the end of the stack (lowest address) and the frame
pointer (FP) is at the highest address in the current stack
frame. Figure 2.1 shows how the stack looks.
In each stack frame, offset 0 from the stack pointer is the frame
pointer of the previous frame and offset 4
(this is illustrating a 32-bit architecture) from the stack pointer
is the return address. Local variables are indexed from the frame
pointer, with negative indexes. In the function
fact, offset -4 from the frame pointer is the
argument n. In the main
function, offset -4 from the frame pointer is the local variable
i and offset -8 from the frame pointer is the
local variable f.
![[Note]](../images/note.png) | Note |
|---|---|
This is a simplified example for illustrative purposes only. Good optimizing compilers would not put anything on the stack for such simple functions. Indeed they might eliminate the recursion and use of the stack entirely! |
It is very easy to get confused when examining stacks. GDB has
terminology it uses rigorously throughout. The stack frame of the
function currently executing, or where execution stopped is numbered
zero. In this example frame #0 is the stack frame of the call to
fact (0). The stack frame of its calling
function (fact(1) in this case) is numbered #1
and so on back through the chain of calls.
The main GDB data structure describing frames is struct frame_info. It is not used directly, but only via its accessor functions. struct frame_info includes information about the registers in the frame and a pointer to the code of the function with which the frame is associated. The entire stack is represented as a linked list of struct frame_info.
It is easy to get confused when referencing stack frames. GDB uses some precise terminology.
THIS frame is the frame currently under consideration.
The NEXT frame, also sometimes called the inner or newer frame is the frame of the function called by the function of THIS frame.
The PREVIOUS frame, also sometimes called the outer or older frame is the frame of the function which called the function of THIS frame.
So in the example of Figure 2.1, if THIS
frame is #3 (the call to fact (3)), the
NEXT frame is frame #2 (the call to
fact (2)) and the PREVIOUS frame is frame
#4 (the call to main ()).
The innermost frame is the frame of the current
executing function, or where the program stopped, in this example,
in the middle of the call to fact (0)). It
is always numbered frame #0.
The base of a frame is the address immediately before the start of the NEXT frame. For a falling stack this will be the lowest address and for a rising stack this will be the highest address in the frame.
GDB functions to analyze the stack are typically given a pointer to the NEXT frame to determine information about THIS frame. Information about THIS frame includes data on where the registers of the PREVIOUS frame are stored in this stack frame. In this example the frame pointer of the PREVIOUS frame is stored at offset 0 from the stack pointer of THIS frame.
The process whereby a function is given a pointer to the NEXT
frame to work out information about THIS frame is referred to as
unwinding. The GDB functions involved in this
typically include unwind in their name.
The process of analyzing a target to determine the information that
should go in struct frame_info is called
sniffing. The functions that carry this out are
called sniffers and typically include
sniffer in their name. More than one sniffer may
be required to extract all the information for a particular frame.
Because so many functions work using the NEXT frame, there is an issue about addressing the innermost frame—it has no NEXT frame. To solve this GDB creates a dummy frame #-1, known as the sentinel frame.
All the frame sniffing functions typically examine the code at the start of the corresponding function, to determine the state of registers. The ABI will save old values and set new values of key registers at the start of each function in what is known as the function prologue.
For any particular stack frame this data does not change, so all the standard unwinding functions, in addition to receiving a pointer to the NEXT frame as their first argument, receive a pointer to a prologue cache as their second argument. This can be used to store values associated with a particular frame, for reuse on subsequent calls involving the same frame.
It is up to the user to define the structure used (it is a void * pointer) and arrange allocation and deallocation of storage. However for general use, GDB provides struct trad_frame_cache, with a set of accessor routines. This structure holds the stack and code address of THIS frame, the base address of the frame, a pointer to the struct frame_info for the NEXT frame and details of where the registers of the PREVIOUS frame may be found in THIS frame.
Typically the first time any sniffer function is called with
NEXT frame, the prologue sniffer for THIS frame will be
NULL. The sniffer will analyze the frame, allocate a prologue
cache structure and populate it. Subsequent calls using the same
NEXT frame will pass in this prologue cache, so the data can be
returned with no additional analysis.
These struct gdbarch functions and value provide analysis of the stack frame and allow it to be adjusted as required.
skip_prologue. The prologue of a function
is the code at the beginning of the function which sets up the
stack frame, saves the return address etc. The code
representing the behavior of the function starts after the
prologue.
This function skips past the prologue of a function if the program counter is within the prologue of a function. With modern optimizing compilers, this may be a far from trivial exercise. However the required information may be within the binary as DWARF2 debugging information, making the job much easier.
The default value is NULL (not defined). This function
should always be provided, but can take advantage of DWARF2
debugging information, if that is available.
inner_than. Given two frame or stack
pointers, return 1 (true) if the first represents the "inner"
stack frame and 0 (false) otherwise. This is used to determine
whether the target has a rising or a falling stack frame. See
Section 2.3.6 for an explanation of "inner"
frames.
The default value of this function is NULL and it should
always be defined. However for almost all architectures one of
the built-in functions can be used:
core_addr_lessthan (for falling stacks)
or core_addr_greaterthan (for rising
stacks).
frame_align. The architecture may have
constraints on how its frames are aligned. Given a proposed
address for the stack pointer, this function returns a
suitably aligned address (by expanding the stack frame). The
default value is NULL (undefined). This function should be
defined for any architecture where it is possible the stack
could become misaligned. The utility functions
align_down (for falling stacks) and
align_up (for rising stacks) will
facilitate the implementation of this function.
frame_red_zone_size. Some ABIs reserve
space beyond the end of the stack for use by leaf functions
without prologue or epilogue or by exception handlers
(OpenRISC 1000 is in this category). This is known as a
red zone (AMD
terminology). The default value is 0. Set this field if the
architecture has such a red zone.
These functions provide access to key registers and arguments in the stack frame.
unwind_pc and
unwind_sp. These functions are given a
pointer to THIS stack frame (see Section 2.3.6 for how frames are represented) and return the value of the
program counter and stack pointer respectively in the PREVIOUS
frame (i.e. the frame of the function that called this one).
frame_num_args. Given a pointer to THIS
stack frame (see Section 2.3.6 for how frames
are represented), return the number of arguments that are
being passed, or -1 if not known. The default value is NULL
(undefined), in which case the number of arguments passed on
any stack frame is always unknown. For many architectures this
will be a suitable default.
GDB can call functions in the target code (for example by using the call or print commands). These functions may be breakpointed, and it is essential that if a function does hit a breakpoint, commands like backtrace work correctly.
This is achieved by making the stack look as though the function had been called from the point where GDB had previously stopped. This requires that GDB can set up stack frames appropriate for such function calls.
The following functions provide the functionality to set up such "dummy" stack frames.
push_dummy_call. This function sets up a
dummy stack frame for the function about to be
called. push_dummy_call is given the
arguments to be passed and must copy them into registers or
push them on to the stack as appropriate for the ABI. GDB
will then pass control to the target at the address of the
function, and it will find the stack and registers set up just
as expected.
The default value of this function is NULL (undefined). If the
function is not defined, then GDB will not allow the user to
call functions within the target being debugged.
unwind_dummy_id. This is the inverse of
push_dummy_call which restores the stack
and frame pointers after a call to evaluate a function using a
dummy stack frame. The default value is NULL (undefined). If
push_dummy_call is defined, then this
function should also be defined.
push_dummy_code. If this function is not
defined (its default value is NULL), a dummy call will use the
entry point of the target as its return address. A temporary
breakpoint will be set there, so the location must be writable
and have room for a breakpoint.
It is possible that this default is not suitable. It might not be writable (in ROM possibly), or the ABI might require code to be executed on return from a call to unwind the stack before the breakpoint is encountered.
If either of these is the case, then
push_dummy_code should be defined to push
an instruction sequence onto the end of the stack to which the
dummy call should return.
When a program stops, GDB needs to construct the chain of struct frame_info representing the state of the stack using appropriate sniffers.
Each architecture requires appropriate sniffers, but they do not form entries in struct gdbarch, since more than one sniffer may be required and a sniffer may be suitable for more than one struct gdbarch. Instead sniffers are associated with architectures using the following functions.
frame_unwind_append_sniffer is used to
add a new sniffer to analyze THIS frame when given a pointer
to the NEXT frame.
frame_base_append_sniffer is used to add
a new sniffer which can determine information about the base
of a stack frame.
frame_base_set_default is used to specify
the default base sniffer.
These functions all take a reference to struct gdbarch, so they are associated with a specific architecture. They are usually called in the struct gdbarch initialization function, after the struct gdbarch has been set up. Unless a default has been set, the most recently appended sniffer will be tried first.
The main frame unwinding sniffer (as set by
frame_unwind_append_sniffer) returns a
structure specifying a set of sniffing functions:
struct frame_unwind
{
  enum frame_type            type;
  frame_this_id_ftype       *this_id;
  frame_prev_register_ftype *prev_register;
  const struct frame_data   *unwind_data;
  frame_sniffer_ftype       *sniffer;
  frame_prev_pc_ftype       *prev_pc;
  frame_dealloc_cache_ftype *dealloc_cache;
};
The type field indicates the type of frame this
sniffer can handle: normal, dummy (see
push_dummy_call in Section 2.3), signal handler or sentinel. Signal
handlers sometimes have their own simplified stack structure for
efficiency, so may need their own handlers.
unwind_data holds additional information which
may be relevant to particular types of frame. For example it may
hold additional information for signal handler frames.
The remaining fields define functions that yield different types
of information when given a pointer to the NEXT stack frame. Not
all functions need be provided. If an entry is NULL, the next
sniffer will be tried instead.
this_id determines the stack pointer and
function (code entry point) for THIS stack frame.
prev_register determines where the values
of registers for the PREVIOUS stack frame are stored in THIS
stack frame.
sniffer takes a look at THIS frame's
registers to determine if this is the appropriate unwinder.
prev_pc determines the program counter
for THIS frame. Only needed if the program counter is not an
ordinary register (see prev_pc in Section 2.3).
dealloc_cache frees any additional memory
associated with the prologue cache for this frame (see Section 2.3.6.2).
In general it is only the this_id and
prev_register functions that need be defined
for custom sniffers.
The frame base sniffer is much simpler. It is a struct frame_base, which refers to the corresponding struct frame_unwind and provides functions yielding various addresses within the frame.
struct frame_base
{
  const struct frame_unwind *unwind;
  frame_this_base_ftype     *this_base;
  frame_this_locals_ftype   *this_locals;
  frame_this_args_ftype     *this_args;
};
All these functions take a pointer to the NEXT frame as
argument. this_base returns the base address
of THIS frame, this_locals returns the base
address of local variables in THIS frame and
this_args returns the base address of the
function arguments in this frame.
As described above the base address of a frame is the address immediately before the start of the NEXT frame. For a falling stack, this is the lowest address in the frame and for a rising stack it is the highest address in the frame. For most architectures the same address is also the base address for local variables and arguments, in which case the same function can be used for all three entries.
It is worth noting that if it cannot be determined in any other
way (for example by there being a register with the name
"fp"), then the result of the
this_base function will be used as the value
of the frame pointer variable $fp in GDB
| |  | |
| 2.3.5. Specifying the Register Architecture |  | 2.4. Target Operations |