| Services - tools - models - for embedded software development |
|---|
| Services - tools - models - for embedded software development |
|---|

 |  | |
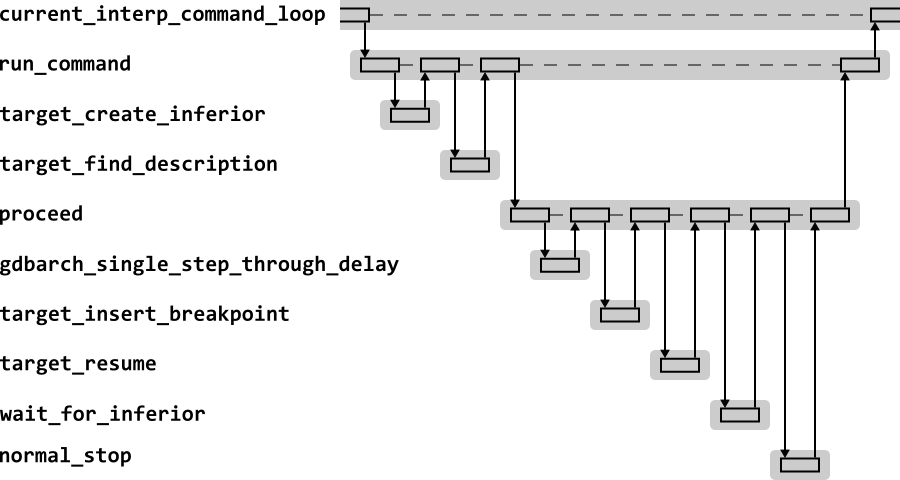
Figure 2.7 shows the high level sequence diagram for GDB in response to the run command.
The run command must create the inferior, insert any active breakpoints and watchpoints, and then start execution of the inferior. Control does not return to GDB until the target reports that it has stopped.
The top level function implementing the run
command is run_command. This creates the
inferior, but calling the current target's
to_create_inferior function. GDB supports
targets which can give a dynamic description of their architecture
(for example the number of registers available). This is achieved
through the to_find_description function of the
current target (which is an empty function by default).
Execution is started by the proceed. This must
first determine if the code is restarting on an instruction which
will need stepping through a delay slot (so that code never stops on
a delay slot). If this functionality is required, it is implemented
by the gdbarch_single_sep_through_delay
function.
Active breakpoints are inserted using the current target's
to_insert_breakpoint function. The code is then
run using the to_resume function of the current
target.
GDB then calls wait_for_inferior, which will
wait for the target to stop, and then determine the reason for the
stop. Finally normal_stop will remove the
breakpoints from the target code and report to the user the current
state of the target as appropriate.
Much of the detailed processing takes place in the
wait_for_inferior and
normal_stop functions (see also their use in
Section 2.11.2). These are important functions
and it is useful to look at their behavior in more detail.
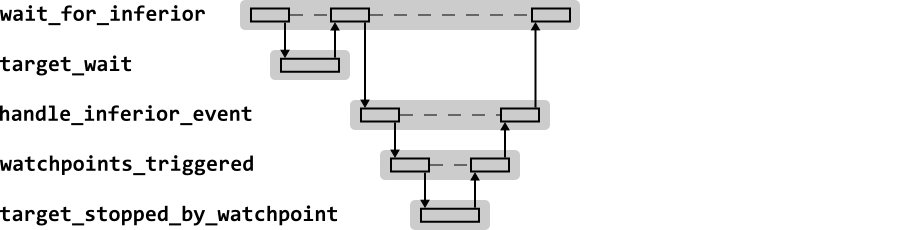
Figure 2.8 shows the sequence
diagram for wait_for_inferior when handling the
GDB run command.
Once again the key work is in
handle_inferior_event. The code checks for
watchpoints using the to_stopped_by_watchpoint
function of the current target. The function also checks
breakpoints, but since it already knows the current program counter
(set by target_wait when control is returned),
it needs no further call to the target
operations. target_wait will have reported if
it stopped due to an exception that could be due to a
breakpoint. handle_inferior_event can then look
up the program counter in the list of active breakpoints, to
determine which breakpoint was encountered.
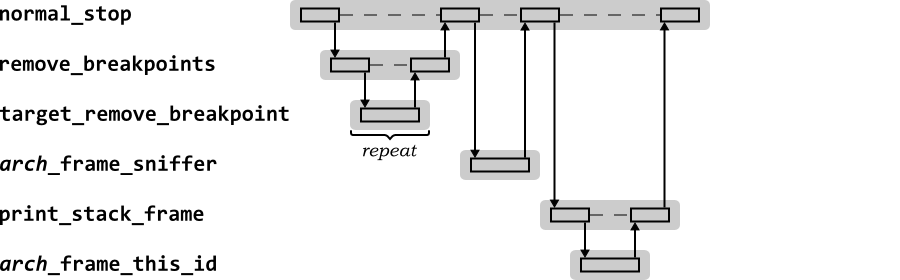
Figure 2.9 shows the sequence
diagram for normal_stop when handling the
GDB run command. In this example the stop was
due to the target encountering a breakpoint.
The first action is to remove breakpoints. This ensures that the target executable is returned to its normal state, without any trap or similar code inserted.
The frame sniffers for the target are identified, using the frame
sniffer for the architecture,
arch_frame_sniffer. The current stack frame
is then printed for the user. This requires use of the frame sniffer
to identify the ID (and hence all the other data) of THIS frame
from the NEXT frame (arch_frame_this_id
here). print_stack_frame will start from the
sentinel frame and work inwards until it finds the stack frame
containing the current stack pointer and program counter.
| |  | |
| 2.11.4. The GDB break Command |  | 2.11.6. The GDB backtrace Command |