2.11.4.
The GDB break Command
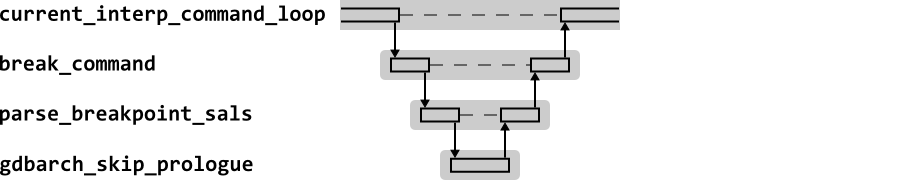
Figure 2.6 shows the high level sequence
diagram for GDB in response to the break
command. This example is for the case where the target of the break
is a symbol (i.e. a function name) in the target executable.
Most of the action with breakpoints occurs when the program is set
running, at which any active breakpoints are installed. However for
any break command, the address for the break must
be set up in the breakpoint data structure.
For symbolic addresses, the start of the function can be obtained
from the line number information held for debugging purposes in the
symbol table (known as symbol-and-line
information, or SAL). For a function, this will yield the start
address of the code. However the breakpoint must be set after the
function prologue. gdbarch_skip_prolog is used to
find that address in the code.