| Services - tools - models - for embedded software development |
|---|
| Services - tools - models - for embedded software development |
|---|

 |  | |
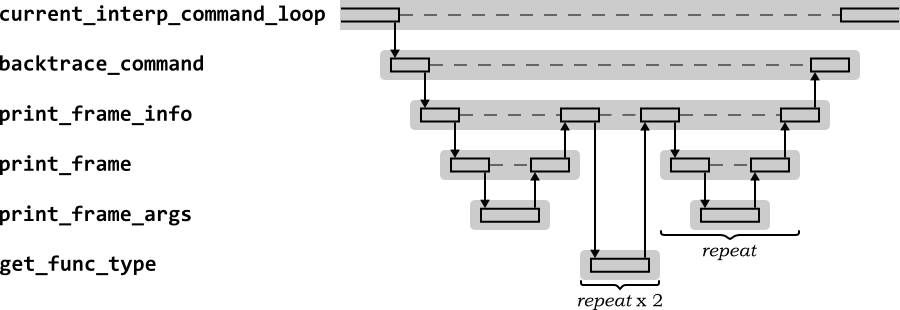
Figure 2.10 shows the high level sequence diagram for GDB in response to the backtrace command. This sequence shows the behavior for the first call to backtrace after control has returned to GDB.
The main command function is backtrace_command,
which uses print_frame_info to print the name
of each function on the stack with its arguments.
The first frame is already known from the program counter and stack
pointer of the stopped target, so is printed out by
print_frame. That will ultimately use the
current target's to_xfer_partial function to
get the local argument values.
Since this is the first backtrace after the
program stopped, the stack pointer and program counter are each
obtained from the sentinel frame using
get_func_type. print_frame
is then called for each frame in turn as the stack is unwound until
there are no more stack frames. The information in each frame is
built up using the architecture's frame sniffers.
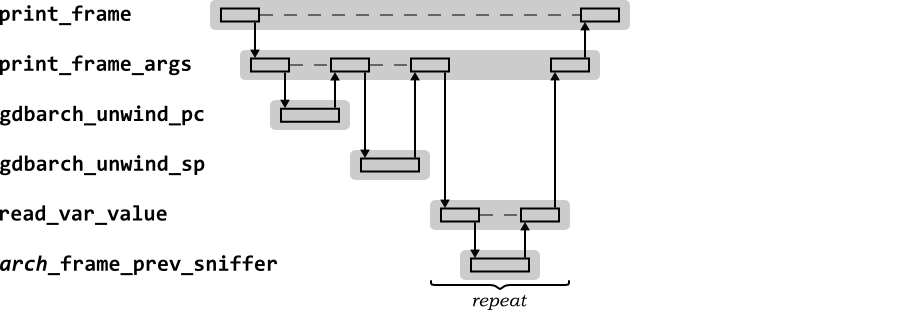
It is useful to look at print_frame in more
detail. Figure 2.11 shows the
sequence diagram for the second series of calls to the
print_frame function when handling the GDB
backtrace command, used to print out the stack
frame.
The information about the function on the stack frame can be
obtained from the program counter and stack pointer associated with
the stack frame. These are obtained by calls to the
gdbarch_unwind_pc and
gdbarch_unwind_sp functions.
Then for each argument, its value must be printed out. The symbol
table debug data will identify the arguments, and enough information
for GDB to work out if the value is on the stack or in a
register. The frame sniffer function to get registers from the stack
frame (in this example
arch_frame_prev_register) is used to get the
values of any registers as appropriate.
The precise sequence of calls depends on the functions in the stack frame, the arguments they have, and whether those arguments are in registers or on the stack.
| |  | |
| 2.11.5. The GDB run Command |  | 2.11.7. The GDB continue Command after a Breakpoint |